Research Article - Imaging in Medicine (2017) Volume 9, Issue 4
Correction of the angular emissivity of human skin for clinical thermal imaging
Boaz Arnon, Kahana Oria, Yoel Arieli*Yoel Arieli, Jerusalem College of Technology Jerusalem, Israel
- Corresponding Author:
- Yoel Arieli
Jerusalem College of Technology Jerusalem
Israel
E-mail: arieli.yoel@gmail.com
Abstract
Clinical thermal imaging is based on the postulation that cancerous tissue is warmer due to enhanced metabolism and increased blood supply. The thermal map of a skin is obtained by imaging the skin by a thermal camera where the amounts of heat energy received by the camera's detectors are interpreted in terms of a distribution of the skin temperature. However, it is well known that the amount of heat energy emitted by a surface also depends on the emissivity of the surface. Theoretical and experimental results have shown that the emissivity depends on the viewing angle of the surface, i.e., the angle between the imaging axis and the normal to the surface. These results indicate a significant fall in the emissivity when the viewing angle is increased beyond 60°, which leads to inaccurate temperature mapping. In our study, several human bodies were thermal mapped in incrementally varying angle from 0° to 90° and the thermal maps were compared. The acquired experimental data was processed to obtain a correction formula for calibrating the measurement error due to the emissivity dependence on the viewing angle. Using the correction formula, the measurements at different viewing angles were calibrated, compared and statistically tested to assess the empirical correction formula.
Keywords
emissivity ▪ curvature artifacts ▪ clinical thermal imaging
Introduction
Clinical thermal imaging is based on the postulation that cancerous tissue is warmer relative to normal tissue due to enhanced metabolism and increased blood supply. Thus, when a cancerous tumor is present, for example in a human breast, its surface temperature map is modified in relation to its expected temperature map according to the tumor’s dimensions and location. Since the apparent thermal radiance of a surface is proportional to the surface's temperature, the temperature map of the surface may be obtained by imaging it by a thermal camera which converts the thermal radiance map of the surface into a grey scale map. The grey scale map is interpreted as a temperature map of the surface which can analyzed. In clinical thermal imaging the temperature map is analyzed to detect suspicious enhanced metabolism and increased blood supply. However, only a perfect Lambertian object exhibits a constant emissivity which is independent on its viewing angle, i.e. the angle between the normal to surface and the imaging system’s optical axis, while for any other object the emissivity also depends on the viewing angle and it decreases as angle increases. Accordingly the apparent thermal radiance of the object decreases as its viewing angle, a fact that may be interpreted as a decrease or an increase in the object's temperature. Therefore, in clinical thermal imaging it is important to comprehend the emissivity behavior of the human skin in the infrared regime as function of the viewing angle in order to acquire an accurate temperature map of the human skin's surface. Theoretical models of the human skin as a non-Lambertian dielectric interface and calculations of the effect of skin's viewing angle on the emissivity were performed by Watmough et al. [1,2] and by Hejazi and Spangler [3]. These theoretical models have shown that a significant fall in the emissivity is obtained when the viewing angle is greater than 65°. Experimental studies [4-7] also have shown, in agreement with the theory, that in the wavelength range of 2-5 μm, the effective emissivity of the human skin reduces significantly when the viewing angle is greater than 60°. Cheng et al. [7] have conducted experiments on a flat copper plate and a metal cylinder filled with warm water and based on the experimental results they have developed a linear formula associated with directional emissivity which supplied a reasonable approximation for the calibration of the measurement error due to the viewing angle.
However, for clinical thermal imaging, the demands on temperature measurement accuracy are much more stringent and the temperature errors induced by the human skin viewing angle must be quantified more accurately.
In this study, the dependency of the human skin’s emissivity on the viewing angle was quantified experimentally by creating three dimensional temperature maps of human skin in various viewing angles and measuring the apparent temperatures as a function of the viewing angles. The experimental results were processed to obtain a precise empirical correction formula for calibrating the measurement error due to emissivity dependency on the viewing angle. Using this empirical correction formula, the measurements at various different viewing angles were calibrated, compared and statistically tested to assess the correction formula.
Methods
■ Equipment
For the measurements of the human skin's viewing angle effect on the skin’s emissivity, an optical head containing an IR camera and a 3D imager consisting an image projector and a CMOS digital camera were used, where all the devices were controlled by a computer. The IR camera was used for obtaining the 2D temperature map of the tested object. The IR camera is an uncooled LWIR Microbolometer PHOTON 320 camera with a frame rate of 9 fps, spatial resolution of 320*256 pixels, temperature sensitivity of 55 mK NEdT and an image digitization of 14 bit raw data.
The 3D imager was used to generate the 3D map of the tested object, based on Structured Light Method (SLM) [8,9]. In this case, the image projector of the 3D imager projects known light patterns on the object while the CMOS digital camera of the 3D imager captures the projected patterns on the object. The 3D map of the object is calculated using triangulation algorithms. Calibration measurements have shown that the 3D imager creates a very accurate 3D map of an object with STD of 1.5 mm.
Using the 2D temperature map 3D map of the tested object, the 3D temperature map of the tested object is created. The 3D temperature map of the object is created by applying serval mathematical steps; in the first step, the optical axis of the 3D imager is rotated mathematically such that it will coincide with the optical axis of the IR camera. Then, the 3D map of the object obtained by the 3D imager is projected onto a 2D plane to obtain a 2D image which is parallel to the IR camera’s image plane. Now, the two images, the 2D projected image and the 2D temperature image obtained by the IR camera are registered and combined into a one 2D image. This 2D image which contains the thermal data is converted back into a 3D temperature map of the object by knowing the spatial data of the original 3D map.
■ Measurements of the human skin
The experiments on human skin where were conducted in an environment with nearly constant temperature around 22°C.
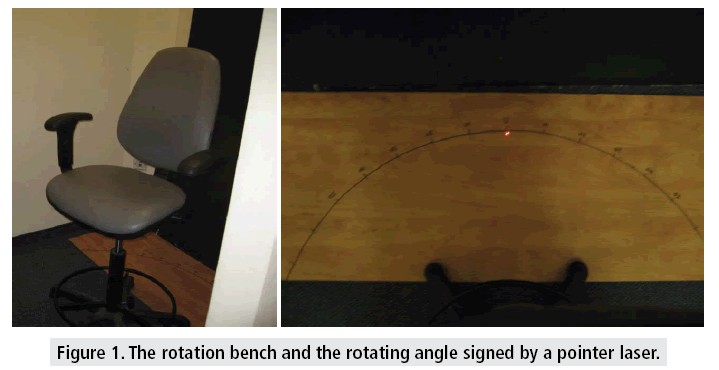
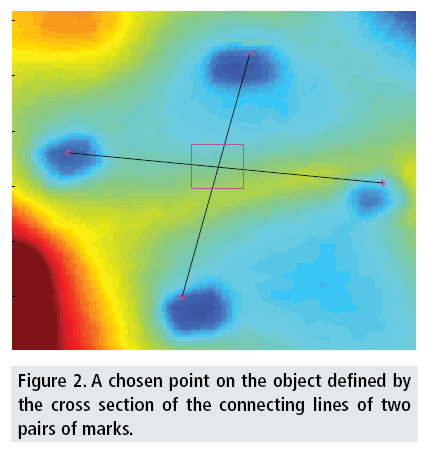
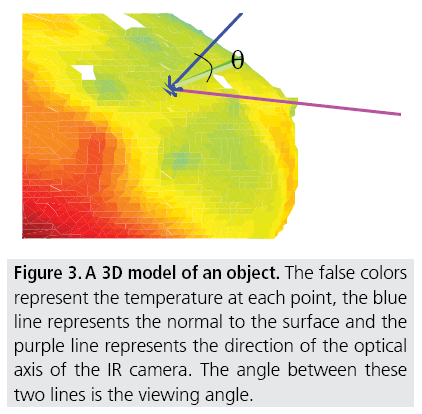
In these experiments, 3D temperature maps of four persons were created. Each person was tested four times where in each time the person was rotated by a rotating bench, shown in FIGURE 1, such that the angle of his front relative to the axis of the IR camera was changed in 10° steps. The overall rotations angles relative to the axis of the IR camera were between -90° to 90°. In each angle, the 3D temperature map of the persons was created as described above. Before the measurements, four evenly distributed points were chosen on each person's skin. As shown in FIGURE 2, every chosen point was marked by two pairs of marks around the point, such that the exact point was defined by the cross section of the connecting lines of each two marks pairs. After obtaining the 3D temperature maps of the human skin at all distinct rotation angles, the viewing angle of each chosen point was calculated. The viewing angle of each point at a certain position was calculated by determining angle between the normal to the surface at the point, using the 3D structure of the human skin and the known camera's position, as shown in FIGURE 3.
Figure 3: A 3D model of an object. The false colors represent the temperature at each point, the blue line represents the normal to the surface and the purple line represents the direction of the optical axis of the IR camera. The angle between these two lines is the viewing angle.
The results of these experiments were processed to obtain an empirical correction function for the emissivity decrease as a function of the viewing angle.
■ The empirical function for the emissivity
The apparent temperatures of each chosen point as function of its viewing angle were measured. Using the measured data and "least squares" algorithms, an empirical formula 2nd degree polynomial formula, Tapp=F [θ], that was the best fit for all measurements was attained. This formula describes the dependency of the apparent temperatures on the viewing angle. By this empirical formula, the apparent temperature at any certain viewing angle can be calculated. Accordingly, the expected temperature, i.e., the temperature that would be obtained at any point when the viewing angle is zero, was calculated.
To evaluate the performance of the empirical correction formula, additional experiments were conducted on three persons, three times each, where on every person's skin, five evenly distributed points were chosen and marked as described above. In these experiments, each person was rotated to two angles -45° and +45° relative to the IR camera's axis. Accordingly, 15 distinct points were measures where each point was measured 6 times. Utilizing the empirical correction formula and knowing the actual viewing angle of each point at each position, the apparent temperature of each point was corrected to the expected temperature, i.e. the temperature that would be obtained at zero viewing angles.
After correction, the RMS of the corrected temperature values distribution of each point was calculated and compared to the RMS of the temperature values distribution before the correction.
The evaluation of the correction process was accomplished by conducting a paired T-test on the two pairs of RMS values of all points. The null hypothesis of the paired T-test was that the difference between RMSs has normal distribution with the mean zero, that is, the correction process will not introduce any significant improvement on the RMS of the temperature differences.
Results and Discussion
■ Experiments
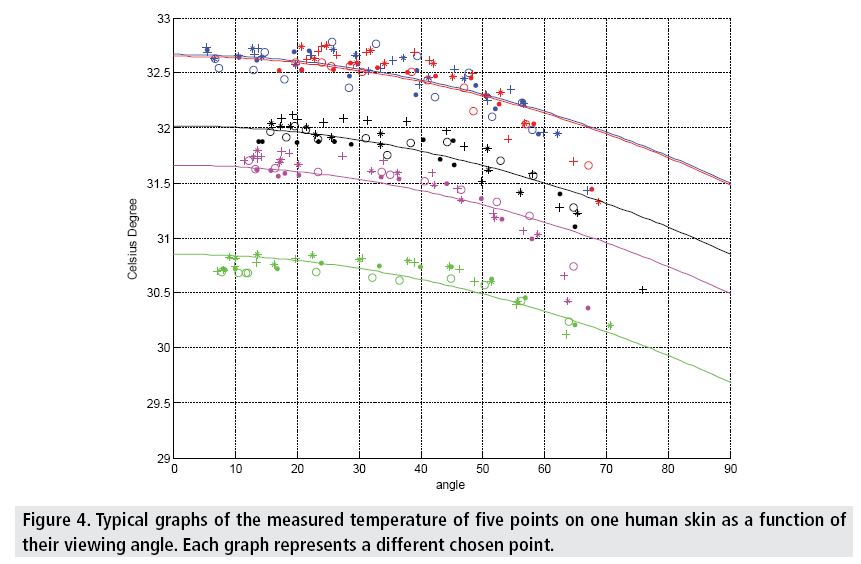
FIGURE 4 shows typical graphs of the measured temperature of five points on one human skin as a function of their viewing angle where every graph describes a different chosen point (the two highest graphs are almost identical).
As shown in the graphs, the apparent temperature decreases monotonically as a function of the viewing angles where the decrease is significant, i.e., more than 0.5°C, for viewing angles larger than 45°.
■ Evaluation of the emissivity empirical function
Using the experimental data and "least squares" algorithm, an empirical 2nd degree polynomial equation that best fits the results was generated.
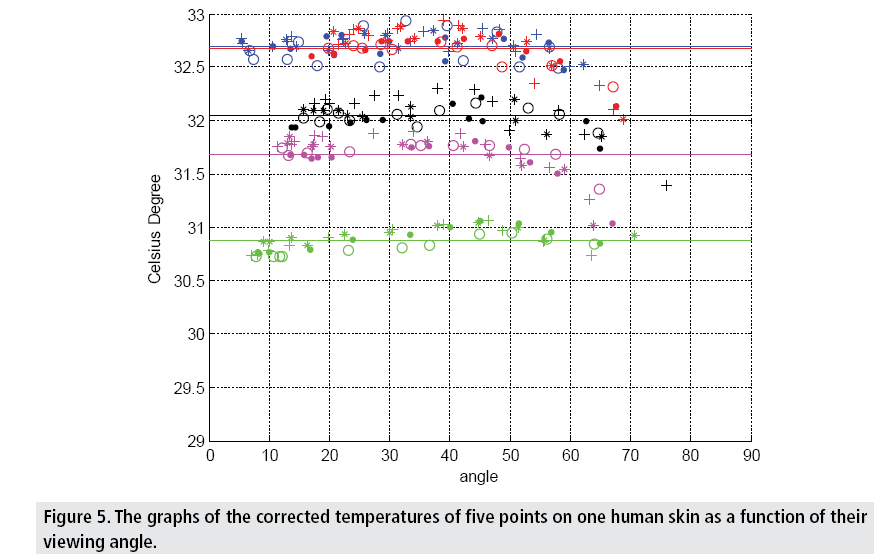
The performance of the empirical equation was evaluated by exanimating it on the results of the additional experiments. Using the empirical equation, the apparent temperature values at each point in the additional experiments were corrected to the expected ones. FIGURE 5 shows the graphs of the corrected temperatures as a function of their viewing angles. The mean and standard deviation of the difference between the temperature values of each point were calculated both before and after the correction. The results are shown in TABLE 1.
| Mean Before | Mean After | STD Before | STD After | |
|---|---|---|---|---|
| 1 | 0.69 | 0.48 | 5.10 | 4.30 |
| 2 | 0.25 | 0.18 | 0.62 | 0.52 |
| 3 | 0.13 | 0.06 | 0.54 | 0.38 |
| 4 | 0.77 | 0.53 | 4.66 | 3.87 |
| 5 | 0.37 | 0.24 | 4.12 | 3.37 |
| 6 | 0.18 | 0.11 | 0.56 | 0.47 |
| 7 | 0.14 | 0.11 | 0.32 | 0.29 |
| 8 | 0.69 | 0.46 | 4.41 | 3.61 |
| 9 | 1.02 | 0.57 | 5.54 | 4.20 |
| 10 | 0.16 | 0.09 | 0.51 | 0.39 |
| 11 | 0.08 | 0.02 | 0.32 | 0.25 |
| 12 | 0.70 | 0.59 | 4.60 | 4.13 |
Table 1: The mean value and the RMS of temperature values at each point before and after correction.
As shown in TABLE 1, the mean and standard deviation is consistently reduced by the correction procedure, indicating a converging process to the actual temperature value at each point. This observation was supported by paired t-tests that were conducted on the mean and the RMS values. The null hypothesis of the paired T-tests was that for each point the difference between the temperature values has normal distribution with the mean zero and that the RMSs values before and after corrections are not significantly different. According to our results, the null hypothesis was rejected with 5% significance level, i.e., with more than 95% confidence level we have obtained that the mean and the RMS of the temperature values differences of each point before correction is higher than the mean and the RMS of the temperature values differences after correction. This implies that by correcting the apparent temperatures to the assumed temperature using the empirical formula, the corrected temperature converges to the actual temperature.
Conclusion
The 3D thermal maps of several human bodies were obtained at incrementally varying angles from 0° to 90°. The experimental data acquired was processed to obtain an empirical 2nd degree polynomial equation for calibrating the decreasing apparent temperature due to dependency of the skin emissivity on the viewing angle. According to our results, the apparent temperature decreases monotonically as a function of the viewing angles where the decrease is significant at viewing angles larger than 45°.
Using the empirical formula, the apparent temperature values of different points at different viewing angles were corrected to the expected temperature values that would obtained at zero viewing angles. By statistical tests it was found that for all points the mean and the RMS of the temperature values differences after correction were smaller than the mean and the RMS of the temperature values differences before correction.
This result implies that by correcting the apparent temperature to the assumed temperature using the empirical correction formula, the corrected temperature value converges to the actual temperature at that point.
It should be noted that the experiments for evaluating the empirical calibration equation were conducted on only four participants and more experiments should be conducted to assess the results. However, although there may be a concern that the emissivity of the participants may vary, it is well known that the human skin emissivity in normal viewing angle was measured in many experiments and was found to be similar for different participants. It is rational to assume that the emissivity behavior as a function of the viewing angle also will be similar for different participants since this is a physical and not physiological phenomenon.
References
- Watmough DJ, Fowler PW, Oliver R. The thermal scanning of a curved isothermal surface: Implications for clinical thermography. Phys. Med. Biol. 15, 1-8 (1970).
- Watmough DJ, Martin CJ. Thermal scanning of curved surfaces. Acta. thermographica. 2, 18-22 (1977).
- Hejazi S, Spangler R. Theoretical modeling of skin emissivity. IEEE. Eng. Med. Biol. Soc. 258-259 (1992).
- Lewis DW, Goller HO, Teates CD. Apparent temperature degradation in thermograms of human anatomy viewed obliquely. Radiology. 106, 95-99 (1973).
- Ash CJ, Gotti E, Haik CH. Thermography of the curved living skin surface. Mol. Med. 84, 702-708 (1987).
- Anbar M. Potential artifacts in infrared thermographic measurements. Thermology. 273, 3 (1991).
- Cheng TY, Deng D, Herman C. Curvature effect quantification for in vivo IR thermography. Int. Mech. Eng. Congress. Expo. IMECE2012-88105, 127-133 (2012).
- Caspi D, Kiryati N, Shamir J. Range imaging with adaptive color structured light. IEEE. Trans. Pattern. Anal. Mach. Intell. 20, 470-480 (1998).
- Valkenburg RJ, McIvor AM. Accurate 3D measurement using a structured light system. Image. Vis. Comput. 16, 99-110 (1998).
