Research Article - Clinical Practice (2017) Volume 14, Issue 5
Variability of left ventricle outflow tract VTI during breathing cycle may predict fluid responsiveness in the postoperative period for non-cardiac spontaneously breathing patients
- Corresponding Author:
- Asta Maciuliene
Department of Anesthesiology
Lithuanian University of Health Sciences
Eiveniu, Kaunas, Lithuania
E-mail: asta.maciuliene@lsmuni.lt
Abstract
Introduction: Different studies show controversial results while discussing which echocardiography parameter is the best to assess fluid responsiveness. The aims of the study were to evaluate the feasibility of echocardiography monitoring in postoperative unit and to assess diagnostic value of different parameters obtained by focused assessed transthoracic echocardiography (FATE) to control non-cardiac patients’ postoperative fluid therapy. Methods: 40 patients who underwent major abdominal surgery and had reduced arterial blood pressure were included in the prospective study. The echocardiography measurements were taken before and immediately after fluid challenge of 500 ml of crystalloids. Positive fluid responsiveness was defined by an increase in stroke volume (SV) of at least 15%. Results: FATE monitoring is feasible in postoperative unit. The identification of fluid responsiveness by clinical signs was significantly lower compared to echocardiography data (p=0.034). Variability of left ventricle outflow tract (LVOT) velocity time integral (VTI) during breathing cycle prognosis fluid responsiveness AUC of the ROC was 0.881. The mitral E wave, E/A ratio and IVC index prognoses fluid responsiveness in spontaneously breathing patients (p=0.006; p<0.001; p<0.001). CI seemed to be not suitable for prognosis of fluid responsiveness (p=0.214). There was no difference between infusion therapy in responders and non-responders neither during operation 2167 ml and 1678 ml (p=0.13) respectively nor in postoperative period 1500 ml and 1678 ml (p=0.344). After FATE the strategy of infusion therapy was changed in 14 (35%) patients. Conclusions: LVOT VTI variability of more than 10% in spontaneously breathing patients had the highest sensitivity and comparable specificity among the parameters used for identification of fluid responders by FATE.
Keywords
focused echocardiography, fluid responsiveness, major surgery
Introduction
Perioperative fluid management remains important topic of the discussion because of permanently appearing evidences that some perioperative fluid administration strategies may even lead to negative post-operative outcomes. The liberal fluid therapy is associated with higher incidence of post-operative complications compared to restrictive one [1] while others claim opposite [2]. However, the definition of liberal or restrictive infusion strategies may be very different in separate medical centers.
Point of care monitoring and individualized infusion therapy should be the aim in the patient management during perioperative period. The pulmonary arterial catheter (PAC) has been considered to be the “gold standard” for monitoring central hemodynamic [3]. Nevertheless, this method is expensive, invasive and associated with high rate of complications, which makes it inappropriate for routine monitoring. Meta-analysis data published in [4] showed echocardiography measurements of SV and cardiac output (CO) achieved similar agreement with bolus thermodilution, which is the gold standard of CO monitoring. Limited or focused assessed transthoracic echocardiography (FATE) is devoted to answering very specific clinical questions that are posed in response to a particular differential diagnosis, using the minimum and most efficient echo views and techniques [5]. FATE gives lots of information, which could be used to control patient’s management [6-9]. It is a promising tool for point of care monitoring including the assessment of fluid therapy management in perioperative period. The aims of the current study were to evaluate the feasibility of echocardiography monitoring in postoperative unit and to assess diagnostic value of different parameters obtained by FATE to control noncardiac patients’ postoperative fluid therapy.
Materials and Methods
The prospective study was carried out in the Anaesthesiology department of Lithuanian University of Health Sciences (LUHS) from the 1st of May to the 1st of September 2016. Ethical approval for this study was provided by the LUHS Kaunas Region Biomedical Research Ethics Committee according to the protocol No. BE-2-4 on 24 January, 2016 (session protocol no. BE-10-4). Trial was registered in ClinicalTrials.gov. Trial registration No. NCT03044405.
Eligibility criteria of the patients were: age ≥ 18 years old; the written consent to participate in this study; patients undergoing major abdominal surgery (gastric resection, gastrectomy, liver resection, pancreatic-duodenal resection, colorectal surgery); reduced mean arterial blood pressure up to 30% from the baseline during the first hour post-surgery.
Exclusion criteria were: known pregnancy; atrial fibrillation; known severe cardiovascular or renal impairment; poor echo image quality.
Demographic characteristics of the study population (age, gender, body mass index, ASA status) were collected. The following clinical signs for evaluation of fluid responsiveness were registered after the first hour post-surgery: heart rate (HR, t/min), non-invasive arterial blood pressure (ABP, mmHg), mean arterial blood pressure (MAP, mmHg), breathing rate (BR, t/min), and hourly urine flow rate (ml/kg/h). Baseline arterial blood pressure was considered as non-invasive measurement of ABP a day before a surgery. The evaluation of fluid responsiveness by clinical signs were defined as urine flow rate less than 0.5 ml/kg/h post-surgery and systolic blood pressure (SBP) increase more than 10 mmHg after fluid challenge [10].
Focused transthoracic echocardiography protocol
All patients received post-operative pain management therapy according the protocol of our anesthesiology department. Before the examination 0–10 numeric rating scale (NRS) was used to evaluate postoperative pain (0-no pain, 1 to 3 mild pain, 4 to 6-moderate pain, 7 to 10-severe pain) [11,12].
The echocardiography was performed in supine position one hour after abdominal surgery. The standard positions for FATE in all patients were: subcostal four chamber view, apical four chamber view, parasternal long axis view and IVC echo windows.
Transthoracic echocardiography was assessed by two trained investigators. The intra- and inter-observer variability of operators for the stoke volume (SV) was 2.5 and 4%. Positive fluid responsiveness was defined by an increase in SV of at least 15% after the fluid challenge of 500 ml of crystalloids given over 15 minutes. Fluid challenge is stopped when SV is not improving. Calculation of SV included LVOT VTI and LVOT diameter. Stroke volume was defined as a product of cross sectional area and VTI: (SV)=cross sectional area x VTI; [13]. The measurements were taken before and immediately after fluid challenge. Patients were divided into responders and nonresponders according to the increase of SV. The measurements of LVOT VTI and LVOT diameter were taken twice and average values were used for further calculations.
The following echocardiography data were registered before fluid challenge: mitral E and A waves, E/A ratio, LVOT VTImax and LVOT VTImin during four breathing cycles, IVCmax and IVCmin diameters during breathing cycles. Variability of LVOT VTI is the product of {(VTImax – VTImin)/ [(VTImax – VTImin)/2] × 100%} [14]. The VTImax and VTImin measurements were recorded during four breathing cycles. The IVC measurements were taken in M-mode 1 cm below the confluence of the hepatic veins [15]. The calculation of IVC variations was made by formula IVC index=(Dmax – Dmin)/Dmax. IVC index was expressed as a percentage [16-18].
The investigators had no influence on intraoperative fluid management. After postoperative evaluation by FATE fluid management was reconsidered. Responders were continuously monitored by FATE.
Statistics
Data were analysed using the SPSS 24.0 software. The Kruskal and Wallis tests were used for comparison of data distributions. Nonparametric, 2 test was used for the analysis of nominal qualitative data. The Mann-Whitney U test was used to compare distributions of two samples. A significance level of 0.05 was considered for all tests. A receiver operating characteristic (ROC) curve was used to determine the threshold value of mitral E and A waves, E/A ratio, LVOT VTI variability, cardiac index (CI) and IVC variations to predict fluid responsiveness, taking into account increase of SV more than 15%. We defined the area under the curve (AUC) to be clinically relevant if AUC was more than 0.7. For defining success rate of fluid responsiveness by different methods Cochrane’s Q test was used.
To detect the significant difference in mean values of variability of VTI during breathing cycles for responders vs. non-responders assuming significance level alpha=0.05 and power of the test=0.8, we should have at least 6 patients in each group.
Results
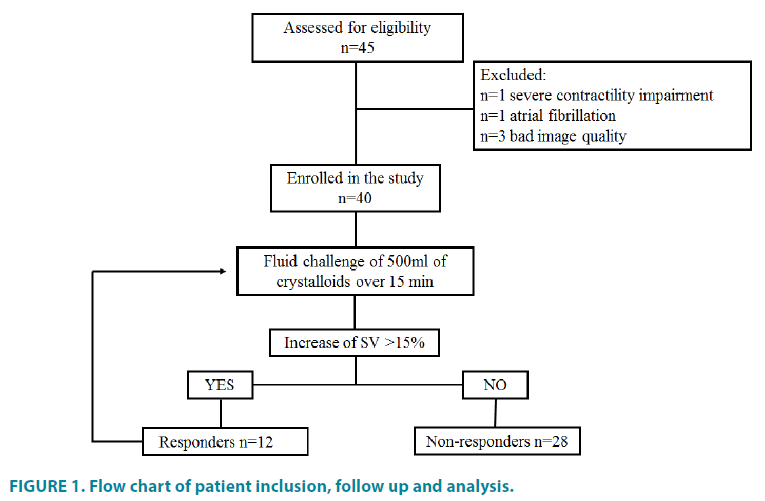
From all the patients who were scheduled for major abdominal surgery at the study period 45 patients were identified as eligible to participate in the study. Five patients were excluded because of the following reasons: one had severe contractility impairment, one had atrial fibrillation and for the rest image quality was not suitable for accurate interpretation. The patient inclusion, follow up and analysis are shown in (FIGURE 1).
Forty patients, 23 (57.5%) men and 17 (42.5%) women, who had reduced MAP from the baseline, were included in the study. The mean age of the patients was 60.8 (56.9- 64.78) years. Sixteen patients (40%) had ASA physical status II and 24 (60%) had physical status III. The median pre-investigational VAS measurement was 3 (min 2, max 7).
An adequate apical and parasternal long axes views were obtained in all 40 (100%) patients. An adequate IVC images from subcostal window were obtained in 33 (82.5%) patients, for the rest 7 (17.5%) patients trans-hepatic acoustic window was used. The proportion of adequate view was significantly lower for the IVC echo window while trying to get the image from subcostal long axis view (p=0.046). The lower success rate of obtaining an adequate subcostal view was associated with experienced moderate postoperative pain (p=0.002). Mild pain (pain rating scale score 1-3) was reported in 21 (52.5%) patients, for all these patients echo images were appropriate for further interpretation. Moderate pain (pain rating scale score 4-6) was reported in 19 (47.5%) cases, for 7 (36.8%) of these patients the images from subcostal view were not obtained. The higher body mass index, had no significant influence on obtaining an adequate echo views from subcostal position (p=0.817). Three of seven patients for whom the subcostal echo window was not obtained had normal BMI, for the rest of the patients BMI was above 25 kg/m2. Data concerning quality and difficulties of obtaining echo images is shown in (TABLE 1).
| Parameters | All patients (N=40) |
Image quality | P value | |
|---|---|---|---|---|
| No image obtained or bad quality | Moderate or good quality |
|||
| IVC (subcostal view) IVC (trans hepatic view) |
40 (100%) | 7 (14.3%) | 33 (85.7%) 7 (100%) |
0.046 |
| Apical four chamber view | 40 (100%) | 0 | 40 (100 %) | >0.05 |
| Parasternal long and short axes view | 40 (100%) | 0 | 40 (100 %) | |
| Difficulties of obtaining subcostal view | ||||
| BMI (kg/m2) <18.4 18.5-24.9 25-29.9 >30 |
- 20 (50%) 8 (20%) 12 (30%) |
- 3 (15%) 2 (25%) 2 (16.7%) |
- 17 (85%) 6 (75%) 10 (83.3%) |
0.817 |
| Pain rating scale Mild (1-3) Moderate (4-6) Severe (7-10) |
4 (min 2, max 6) 21 (52.5%) 19 (47.5%) - |
5 (min 4, max 6) 0 7 (36.8%) - |
3 (min 1, max 5) 21 (100%) 12 (63.2%) - |
0.002 |
Table 1. Feasibility of focused transthoracic echocardiography in postoperative period.
The increase of SV of more than 15% after volume expansion was found in 12 patients (30%) while increase of SBP more than 10 mmHg occurred only in 6 (15%) patients. Characteristics of the patients and comparison between responders and non-responders are shown in (TABLE 2).
| Parameter | All patients | Responders | Non-responders | P value |
|---|---|---|---|---|
| Patients | 40 (100%) | 12 (27.5%) | 29 (72.5%) | - |
| Age | 60.8 (56.9-64.78) | 62 (57.22-66.78) | 60.45 (55.2-65.68) | 0.881 |
| Gender: Male Female |
23 (57.5%) 17 (42.5%) |
9 2 |
14 15 |
0.55 |
| Body mass index | 27.29 (±6.38) | 25.44 (±3,8) | 28.07 (±7.1) | 0.131 |
| ASA status: II III |
16 (40%) 24 (60%) |
3 (18.8%) 8 (33.3%) |
13 (81.2%) 16 (66.7%) |
0.425 |
| Visual analogue scale | 3 (1 - 6) | 4 (3-5) | 3 (1-6) | 0.72 |
| Heart rate | 71 (±12) | 70 (± 13) | 71 (± 12) | 0.633 |
| MAP (mmHg) | 63.4 (±7.21) | 62.9 (± 7.91) | 63.6 (±7.02) | 0.78 |
| Breathing rate | 14 (± 2) | 13 (± 1.6) | 14 (± 2.5) | 0.254 |
| Urine flow rate(ml/kg/h) | 1.03 (±0.51) | 0.75 (± 0.34) | 1.25 (± 0.38) | <0.001 |
| VTI max | 22.1 2 (±4.32) | 20.69 (± 4.54) | 22.73 (± 4.16) | 0.198 |
| VTI min | 20.48 (±4.45) | 17.57 (± 4.25) | 21.59 (± 4.07) | 0.018 |
| VTI variability (%) | 8.13 (±5.82) | 14 (± 5.9) | 6.48 (± 12.9) | <0.001 |
| Mitral E wave (cm/s) | 84.43 (±18.17) | 72.14 (± 14.5) | 89.7 (± 17.2) | 0.004 |
| ∆ E (cm/s) | 4.63 (±4.98) | 9.28 (±5.9) | 2.64 (±2.84) | 0.003 |
| E/A ratio | 1.022 (±0.18) | 0.87 (± 0.096) | 1.086 (± 0.16) | <0.001 |
| ∆ E/A | 0.065 (±0.067) | 0.07 (±0.02) | 0.04 (±0.008) | 0.001 |
| Inferior vena cava index (%) | 28.1 (± 16.6) | 32.29 (± 13.48) | 11.03 (± 12.24) | <0.001 |
| Cardiac index (L/min/m2) | 3.21 (± 0.98) | 2.89 (± 1.06) | 3.35 (± 0.94) | 0.214 |
| Infusion therapy in operating room (ml) | 1825 (± 792) | 2167 (± 961) | 1678 (± 676) | 0.13 |
| Planed infusion therapy in postoperative unit before FATE (ml) | 1550 (± 563) | 1500 (± 522) | 1678 (± 564) | 0.344 |
| Infusion therapy in postoperative unit after FATE (ml) | 1176 (±599) | 1629 (±120) | 982 (±106) | 0.01 |
| MAP – mean arterial pressure; VTI – velocity time integral; | ||||
Table 2. Characteristics of the patients and comparison between responders and nonresponders.
The identification of fluid responsiveness by the complex of clinical signs was significantly lower compared to echocardiography data (p=0.034).
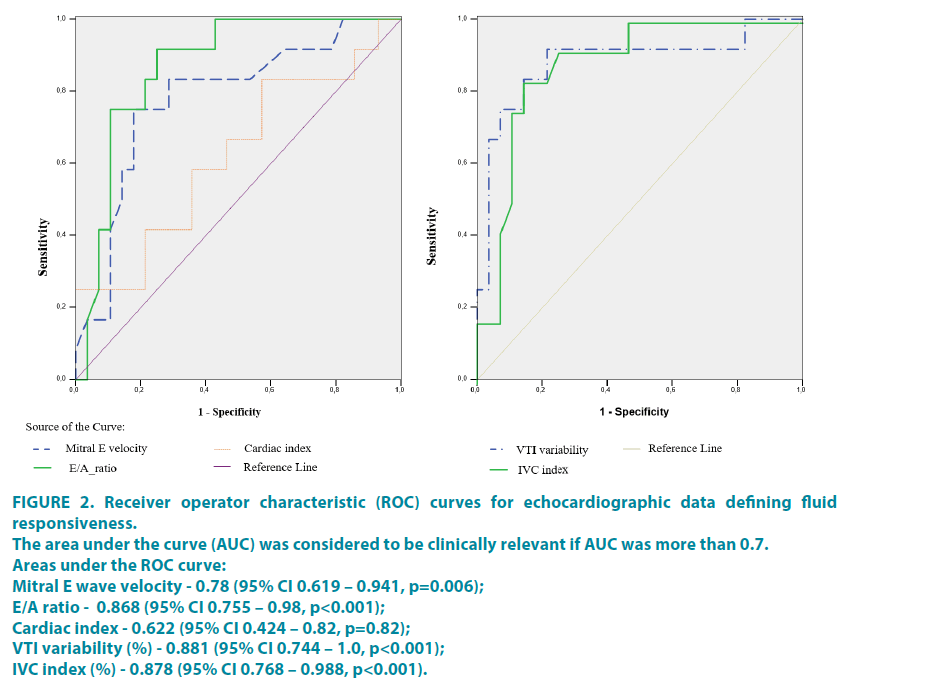
Variability of LVOT VTI during breathing cycle was significantly higher in responders compared to non-responders 14% (± 5.9) and 6.48% (± 12.9), respectively (p<0.001). ROC analysis showed AUC 0.881 (95% CI 0.744–1.0, p<0.001), the best cut off value was 10% with 83.3% sensitivity and 85.7% specificity.
The mitral E wave velocity was 72.14 cm/s (± 14.5) in responders compared to 89.7 cm/s (± 17.2) in non-responders. ROC analysis showed AUC was 0.78 (95% CI 0.619 – 0.941, p=0.006), the best cut off value was 78.5 with 75% sensitivity and 82.1% specificity. The increase of mitral E wave after fluid challenge was bigger in responders compared to non-responders 9.28 cm/s (± 5.9) and 2.64 cm/s (± 2.84) (p=0.003). Calculation of ΔE is suitable parameter to predict fluid responsiveness as AUC under the ROC curve was 0.893 (95% CI 0.794–0.992, p p<0.001). The Increase of E wave more than 4 cm/s can predict fluid responsiveness with sensitivity of 91.7% and specificity of 78.6%. The similar results were with A/E ratio: mean E/A ratio in responders were 0.87 (SD 0.096) and in non-responders 1.086 (± 0.16), AUC was 0.868 (95% CI 0.755–0.98, p<0.001), the best cut off value 0.913 with 75% sensitivity and 89.3% specificity. The increase of E/A ratio after fluid bolus was bigger in responders compared to non-responders 0.07 (± 0.02) and 0.04 (± 0.008) respectively (p=0.001). The AUC under the ROC curve was 0.878 (95% CI 0.76–0.995, p<0.001). The Increase of E/A ratio more than 0.07 can predict fluid responsiveness with sensitivity of 83.3% and specificity of 85.7%.
Although cardiac index was lower in responders 2.89 L/min/m2 (± 1.06) compared to non-responders 3.35 L/min/m2 (± 0.94) the difference was not significant (p=0.214). According to ROC analysis AUC was 0.622 (95% CI 0.424 – 0.82, p=0.82). CI seemed to be not suitable for prognosis of fluid responsiveness.
The variability of IVC was significantly higher in responders 32.29% (± 13.48) compared to 11.03% (± 12.24) in nonresponders (p<0.001). The AUC of the ROC curve for IVC variability index was 0.878 (95% CI 0.768 – 0.988, p<0.001) and the best cut off value seemed to be 26.6% with 75% sensitivity and 82.8% specificity.
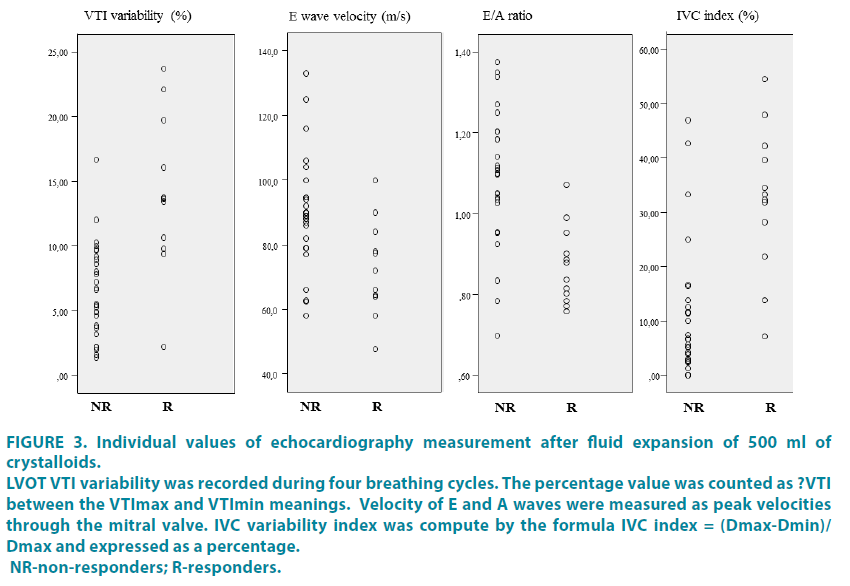
The results of ROC analysis are show in (FIGURE 2). The individual values of these parameters for responders and non-responders are shown in (FIGURE 3).
Figure 2: Receiver operator characteristic (ROC) curves for echocardiographic data defining fluid responsiveness.
The area under the curve (AUC) was considered to be clinically relevant if AUC was more than 0.7.
Areas under the ROC curve:
Mitral E wave velocity - 0.78 (95% CI 0.619 – 0.941, p=0.006);
E/A ratio - 0.868 (95% CI 0.755 – 0.98, p<0.001);
Cardiac index - 0.622 (95% CI 0.424 – 0.82, p=0.82);
VTI variability (%) - 0.881 (95% CI 0.744 – 1.0, p<0.001);
IVC index (%) - 0.878 (95% CI 0.768 – 0.988, p<0.001).
Figure 3: Individual values of echocardiography measurement after fluid expansion of 500 ml of crystalloids.
LVOT VTI variability was recorded during four breathing cycles. The percentage value was counted as ?VTI between the VTImax and VTImin meanings. Velocity of E and A waves were measured as peak velocities through the mitral valve. IVC variability index was compute by the formula IVC index = (Dmax-Dmin)/Dmax and expressed as a percentage. NR-non-responders; R-responders.
There was no difference between infusion therapy in responders and non-responders during operation 2167 (± 961) ml and 1678 (± 676) ml (p=0.13) respectively. Before the evaluation by FATE planed postoperative fluid therapy was also similar for responders and nonresponders 1500 (± 522) ml and 1678 (± 564) ml respectively (p=0.344). The infusion therapy for non-responders was reduced in average up to 982 (± 120) ml from the primary plan 1678 (± 564) which was before the assessment by FATE (p=0.01).
Discussion
It is well known, that the golden standard for overall hemodynamic monitoring is pulmonary artery catheterization. However, because of limitations mentioned above this method is not routinely used for monitoring. Non-invasive methods like echocardiography are also reliable for this purpose [19]. One of the main, but at the same time-banal problems is process of obtaining echo images [20]. Images obtained from apical, parasternal short and long axis view were suitable for interpretation and were informative. We were unable to obtain subcostal view in all cases. For 35 (87.5%) patients, subcostal images were informative. For 7 (30.4%) patients we could not obtain IVC images from subcostal long axis view. Nevertheless, measurements of IVC diameter were performed for all patients because transhepatic acoustic window was to get missing images. According to our study - different acoustic window did not affect IVC diameter values because the protocol was followed and all measurement of IVC diameter were taken in M mode 2-3 cm from right atrium [16-18,21]. The most common reasons of image quality in subcostal position were postoperative pain and wound dressings.
There are many suggestions for fluid responsiveness monitoring using ultrasound hemodynamic measurement techniques and indices [19,20,22-24]. The identification of fluid responsiveness by LVOT VTI changes more than 15% after volume expansion is not new and widely used [25]. This method is specific and sensitive. Feissel et al. found that aortic velocity changes are specific parameter for predicting hemodynamic response to volume expansion for ventilated patients with septic shock [24]. Similarly, the variations of aortic blood flow velocity predicted fluid responsiveness in mechanically ventilated children [26,27]. Unfortunately, this method requires fluid challenge to identify the increase of the parameter. Variability in aortic blood flow during breathing cycles more than 12% is associated with fluid responsiveness in spontaneously breathing healthy volunteers [14]. However, spontaneous breathing is a limitation of dynamic methods for prediction of fluid responsiveness. There are several factors which have influence on dynamic parameters. Regular variations in intrathoracic pressure, tidal volume and rate are variable in spontaneous breathing patients [28]. Also abdominal muscles contractions are common with spontaneous breathing efforts. What we found new and unexpected in our study was LVOT VTI variability more than 10% during breathing cycle was associated with positive fluid responsiveness in spontaneously breathing patients after major abdominal surgery with high specificity and sensitivity. Even though limitations of dynamic parameter for nonventilated patients were mentioned, some of them were excluded or minimized. First of all, even though we did not affect the breathing rate of the subjects and did not ask to change the manner of breathing the mean breathing rate was 14 (+/-2) times per minute. There was no difference according to this parameter between responders and non-responders. Of course the deep or forced breathing could affect results more likely. The breathing excursions in postoperative patients are more superficial rather than deep as pain is imminent in postoperative period despite all the efforts of pain management. What is more, the current condition minimizes the abdominal muscles effect on spontaneous breathing. So in this case, one more limitation was excluded. The measurements were taken twice by each investigator to minimize the errors. According to our data LVOT VTI variability during breathing cycles seems to be useful parameter for identification of fluid responders in spontaneously breathing patients. The main advantage of this parameter is that no fluid challenge is needed to predict fluid responsiveness.
There is an evidence that decreased values of mitral E and mitral E/A ratio can predict fluid responsiveness [16,29,30]. According to our data the patients may be identified as responders if mitral E velocity value is less than 78.5 cm/s and mitral E/A ratio less than 0.913. Other authors recommend to define responders when mitral E velocity is less than 70 and E/A ratio is less than 0.8 [16,30]. Decreased mitral E velocity and E/A ratio values seemed to predict fluid responsiveness with high sensitivity and specificity. However, mitral E velocity and E/A ratio values are affected by several factors. The values of mitral inflow velocities changes with age: the mitral E velocity and E/A ratio decrease with aging [23]. So age of the patient should be taken into account. Also these parameters depend on heart rate, rhythm, PR interval, cardiac output, mitral annular size, and LA function. We did not include patients with atrial fibrillation or severe heart dysfunction in our study. According to these limitations the results might be false positive though we haven’t found any difference between responders and non-responders by age, gender and heart rate. We found significant increase of E wave and E/A ratio after fluid challenge in responders compared to non-responders. This finding suggests that E wave and E/A ratio are suitable parameters for defining fluid responsiveness with condition that there is no impairment of left ventricle relaxation.
Coming back to the golden standard for cardiac output monitoring is pulmonary artery catheterization. However non-invasive method - echocardiography are also reliable for these measurements [19]. It was found that CI significantly increases after fluid bolus; measurements were made using trans pulmonary thermodilution method [31]. One of the studies has shown that CI measured by echocardiography was significantly decreased for responders compared to non-responders [14]. Our study does not confirm this data. Although we found that cardiac index was lower in responders, the difference was not significant. It is possible that the insufficiency of the fluids was not severe enough in responders to show statistically significant difference.
Inferior vena cava (IVC) variability index seems to be reliable measurement to evaluate fluid responsiveness for the patients under mechanical ventilation [22,32]. However, IVC variability index for spontaneously breathing patients is debatable. According to Muller et al IVC variations more than 40% are associated with fluid responsiveness, however variations less than 40% lead us to the grey zone and should be interpreted carefully [16,18]. Other study confirms that IVC variability for shock patients less than 36.5% suggests the absence of an adequate response to a fluid challenge [17]. According to our data the IVC variation greater than 26.6% was associated with fluid responsiveness. However, there were responders with IVC variations less than 20%. Our data confirms the statement that we cannot exclude fluid responsiveness if IVC variability is small. Furthermore, one study in heterogeneous population has found that IVC variations do not predict fluid responsiveness at all [33]. The value of IVC variability or index in identifying fluid responders in spontaneously breathing patients remains the object of discussion as the results of most studies are diverse [16-18,22,33]. Moreover, it is known that breathing manner significantly affects IVC diameter [16,34,35]. In our case, the postoperative pain could have had an effect on breathing manner (pain causes less change in intrathoracic excursion) and that might lead to missing fluid responders by IVC index despite the fact that the distribution of patient by pain ranking scale was homogeneous.
Our study addresses the problem of individualized perioperative fluid monitoring strategy. There was no difference in amounts of infusion comparing responders and nonresponders neither during operation, nor in postoperative unit. Echo monitoring was not only useful for step up interventions but also for step down decisions. It is equally important to know when to stop giving fluids as excessive fluid therapy is associated with higher risk of cardiopulmonary complications and may impair tissue healing after surgery [36]. Having in mind that the basic aim of intraoperative fluid therapy is to ensure organ perfusion and oxygen delivery to the tissues we should give fluids only when needed and as much as needed. FATE may facilitate decision making during perioperative period.
The current study has some limitations. One of the limitations is that the investigators were not blinded. Secondly, the passive leg rising test (PLR) is not the routine test in our postoperative unit so the fluid challenge was chosen. PLR test allows to avoid an excessive fluid administration. Our study showed that when non-responders were identified fluid management plan was reconsidered. Despite the 500 ml bolus which was given to identify responders the cumulative amount of the fluids for non-responders was reduced in average about 950 (± 350) ml from the primary plan. Finally, errors of SV measurement exist. It was measured several times by each investigator. The intra- and inter-observer variability of operators for the stoke volume was assessed and described in methods section.
LVOT VTI variability seems to be suitable parameter for identification of fluid responsiveness; however more studies are needed to confirm our data. Before the evaluation by FATE there were no difference concerning infusion management strategy in responders and non-responders. This supports an idea, that further studies are needed to evaluate the influence of individualized perioperative fluid management based on focused echocardiography data for outcomes after major abdominal surgery.
Conclusions
In most cases it was possible to get good quality echocardiographic images after major abdominal surgery. LVOT VTI variability of more than 10% in spontaneously breathing patients had the highest sensitivity and comparable specificity among the parameters used for identification of fluid responders by FATE.
Acknowledgements
Assistance with the study: none
Sources of support: Departmental sources
Conflict of interest: Asta Maciuliene - none
Almantas Maleckas - none
Algimantas Krisciukaitis - none
Vytautas Maciulis - none
Andrius Macas - none
Presentation: none
References
- Doherty M, Buggy D. Intraoperative fluids: how much is too much? Br. J.Anaesth.109(1), 69-79 (2012).
- Vermeulen H, Hofland J, Legemate DA, Ubbink DT. Intravenous fluid restriction after major abdominal surgery: a randomized blinded clinical trial. Trials. 10,50 (2009).
- Gutierrez MC, Moore PG, Liu H. Goal-directed therapy in intraoperative fluid and hemodynamic management. J. Biomed. Res.27, 357-365 (2013).
- Chong SW, Peyton PJ. A meta-analysis of the accuracy and precision of the ultrasonic cardiac output monitor (USCOM). Anaesthesia.67(11), 1266-1271 (2012).
- Holm JH, Frederiksen CA, Juhl-Olsen P, Sloth E. Perioperative use of focus assessed transthoracic echocardiography (FATE). AnesthAnalg. 115(5), 1029-32 (2012).
- Neale D, Williams D, Canty D. Cost-Benefit Analysis of Focused Pre-Operative Transthoracic Echocardiography in the Pre-Operative Clinic in Patients at Increased Cardiac Risk Presenting for Non-Cardiac Surgery-A Pilot Study. Int. J.Anesth.2(1), 23 (2015).
- Cowie B. Three years’ experience of focused cardiovascular ultrasound in the peri-operative period.Anaesthesia.66(4), 268-273 (2011).
- Canty D, Royse C, Kilpatrick D, Bowman L, Royse A. The impact of focused transthoracic echocardiography in the pre-operative clinic.Anaesthesia.67, 618-625 (2012).
- Lynes H, Griffiths R. Focused transthoracic echocardiography in hip fracture surgery. Anaesthesia.68, 206-207 (2013).
- Dong Z, Fang Q, Zheng X, Shi H. Passive leg raising as an indicator of fluid responsiveness in patients with severe sepsis. World J Emerg Med. 3(3), 191-196 (2012).
- Hjermstad MJ, Fayers PM, Haugen DF, et al. Studies comparing Numerical Rating Scales, Verbal Rating Scales, and Visual Analogue Scales for assessment of pain intensity in adults: a systematic literature review. J. Pain Symptom Manage.41, 1073-1093 (2011).
- Haefeli M, Elfering A. Pain assessment. Eur. Spine J. 15, S17-S24 (2006).
- Porter TR, Shillcutt SK, Adams MS, et al. Guidelines for the use of echocardiography as a monitor for therapeutic intervention in adults: a report from the American Society of Echocardiography. J. Am. Soc. Echocardiogr.28(1), 40-56 (2015).
- Skulec R, Cermak O, Skalicka H, Kolar J. Variability of aortic blood flow predicts fluid responsiveness in spontaneously breathing healthy volunteers. Kardiol. Pol.67(3), 265-271 (2006).
- Sridhar H, Mangalore P, Chandrasekaran V, Manikam R. Caval Aorta Index and Central Venous Pressure Correlation in Assessing Fluid Status!“Ultrasound Bridging the Gap”ISRN Emerg.Med.Article ID 828626 (2012).
- Muller L, Bobbia X, Toumi M, et al. Respiratory variations of inferior vena cava diameter to predict fluid responsiveness in spontaneously breathing patients with acute circulatory failure: need for a cautious use. Crit. Care.16(5), R188 (2012).
- ValkDe S, Olgers TJ, Holman M, et al. The caval index: an adequate non-invasive ultrasound parameter to predict fluid responsiveness in the emergency department? BMC Anesthesiol.14, 114 (2014).
- Airapetian N, Maizel J, Alyamani O, et al. Does inferior vena cava respiratory variability predict fluid responsiveness in spontaneously breathing patients? Crit Care.19, 400 (2015).
- Pugsley J, Lerner AB. Cardiac output monitoring: is there a gold standard and how do the newer technologies compare? Semin.Cardiothorac.Vasc.Anesth.14(4), 274-282 (2010).
- Chew MS. Haemodynamic monitoring using echocardiography in the critically ill: a review. CardiolRes Pract.Article ID 139537 (2012).
- Brennan JM, Ronan A, Goonewardena S, et al. Handcarried ultrasound measurement of the inferior vena cava for assessment of intravascular volume status in the outpatient hemodialysis clinic. Clin. J. Am. Soc.Nephrol.1(4), 749-753 (2006).
- Zhang Z, Xu X, Ye S, Xu L. Ultrasonographic measurement of the respiratory variation in the inferior vena cava diameter is predictive of fluid responsiveness in critically ill patients: systematic review and meta-analysis. Ultrasound Med. Biol. 40(5) 845-853 (2014).
- Nagueh SF, Appleton CP, Gillebert TC, Marino PN, Oh JK, Smiseth OA, et al. Recommendations for the evaluation of left ventricular diastolic function by echocardiography. J. Am. Soc.Echocardiogr.22(2), 107-133 (2009).
- Feissel M, Michard F, Mangin I, et al. Respiratory changes in aortic blood velocity as an indicator of fluid responsiveness in ventilated patients with septic shock. Chest.119(3), 867-873 (2001).
- Wu Y, Zhou S, Zhou Z, Liu B. A 10-second fluid challenge guided by transthoracic echocardiography can predict fluid responsiveness. Crit. Care.18(3), R108 (2014).
- Durand P, Chevret L, Essouri S, Haas V, Devictor D. Respiratory variations in aortic blood flow predict fluid responsiveness in ventilated children. Intensive Care Med. 34(5), 888-894 (2008).
- Choi DY, Kwak HJ, Park HY, et al. Respiratory variation in aortic blood flow velocity as a predictor of fluid responsiveness in children after repair of ventricular septal defect. Pediatr.Cardiol. 31:1166-1170 (2010).
- Hasanin A. Fluid responsiveness in acute circulatory failure. J. Intensive Care.3, 50 (2015).
- Solus-Biguenet H, Fleyfel M, Tavernier B, et al. Non-invasive prediction of fluid responsiveness during major hepatic surgery. Br. J.Anaesth.97(6), 808-816 (2006).
- Dokainish H, Zoghbi WA, Lakkis NM, et al. Optimal noninvasive assessment of left ventricular filling pressures a comparison of tissue Doppler echocardiography and B-type natriuretic peptide in patients with pulmonary artery catheters. Circulation.109(20), 2432-2439 (2004).
- Suria S, Wyniecki A, Eghiaian A, Monnet X, Weil G. Measurement of Cardiac Index by TranspulmonaryThermodilution Using an Implanted Central Venous Access Port: A Prospective Study in Patients Scheduled for Oncologic High-Risk Surgery. PloS One.9(8), e104369 (2014).
- Duwat A, Zogheib E, Guinot PG, et al. The gray zone of the qualitative assessment of respiratory changes in inferior vena cava diameter in ICU patients.Crit. Care.18(1), R14 (2014).
- Corl K, Napoli AM, Gardiner F. Bedside sonographic measurement of the inferior vena cava caval index is a poor predictor of fluid responsiveness in emergency department patients. Emerg. Med.Australas.24(5), 534-539 (2012).
- Laborda A, Sierre S, Malvè M, et al. Influence of breathing movements and Valsalva maneuver on vena caval dynamics. World J. Radiol.6(10), 833-839 (2014).
- Kimura BJ, Dalugdugan R, Gilcrease GW, et al. The effect of breathing manner on inferior vena caval diameter.Eur J Echocardiogr.12(2), 120-123 (2011).
- Gouveia V, Marcelino P, Reuter DA. The role of transesophageal echocardiography in the intraoperative period.Curr.Cardiol.Rev.7(3), 184-196 (2011).
