Research Article - Clinical Practice (2018) Volume 15, Issue 5
T and B cells immunophenotypes in blood and urine of patients with focal segmental glomerulosclerosis in relation to disease severity
Sabiha Anis1*, Ejaz Ahmed2, Rana Muzaffar1, Syed Adibul Hasan Rizv31Department of Immunology, Sindh Institute of Urology and Transplantation, Karachi, Pakistan
2Department of Nephrology, Sindh Institute of Urology and Transplantation, Karachi, Pakistan
3Department of Urology, Sindh Institute of Urology and Transplantation, Karachi, Pakistan
- Corresponding Author:
- Sabiha Anis
Department of Immunology
Sindh Institute of Urology and Transplantation
Karachi, Pakistan
E-mail: Sabiha_anis@hotmail.com
Abstract
Background: Disordered immune system is responsible for the pathogenesis in most of the glomerulonephritis (GN) including FSGS. Elucidation of involvement of immune cells is important to avoid invasive procedures for monitoring of disease progression. Methods: We analyzed the frequencies of CD25, CD122 and CD5 on CD4+, CD8+ and CD19+ T and B cells in blood and urine samples of 50 individuals including FSGS, other GN, pathological controls (PC)) and healthy controls (HC)). Data was analyzed using spss software. Results: The ratio of CD4+25+to CD4+122+ was found significantly low in blood of FSGS patients compared to HC and PC (37.6 ± 44.1% vs. 100% in HC and PC, P = 0.000). The ratio of CD19+25+ to CD19+122+ cells were also significantly low in FSGS compared to HC (21.6 ± 20.6% vs.9.4 ± 7.7%, P =0.021) . Overall, the percentages CD4+ 25+ 122+, CD8+25+ 122+and CD19+25+ 122+ cells were more in the urine of FSGS patients compared to controls. CD19+5+ B cells were significantly high in blood and urine of FSGS compared to controls. These cells were also significantly more in the blood of steroid dependent and resistant FSGS patients compared to steroid responsive and in urine of patients with renal dysfunction compared to normal renal functions. Conclusions: Our results show that T and B cells have a definite role in the pathogenesis of FSGS. A low expression of CD25 found on T and B cells in FSGS found in this study indicate down regulation of Treg and Breg cells in these patients. A high expression of CD5+B in blood and urine of FSGS may be responsible for disease severity. The results of this study are important as it may help in avoiding unnecessary invasive procedure for patient monitoring. However there is a need to do further studies to validate these results.
Keywords
autoreactive B cells, breg cells, focal segmental glomerulosclerosis (fsgs), treg cells, steroid sensitive fsgs, steroid resistant fsgs, steroid dependent fsgs
Introduction
Focal segmental glomerulosclerosis (FSGS) comprises a group of glomerular lesions with various clinical manifestations and is characterized by proteinuria [1,2] . Histologically it is characterized by the accumulation of extracellular material in glomerular tufts consisting of increased collagen, cellularity or both. It can be primary as well as secondary and is the most common cause of end stage renal disease (ESRD) in children and adults worldwide as well as in Pakistan [3-5]. Globally, the prevalence of FSGS is around 20% to 40% [5,6]. The incidence of FSGS among patients with nephrotic syndrome, as reported from various centers in Pakistan ranges between 8%-38% [7-9]. The FSGS is an important cause of steroid resistant nephrotic syndrome (SRNS), with 50% culminating in end stage renal disease (ESRD) [10,11]. These patients are also at increased risk of developing recurrence after renal transplantation with graft failure in about 40% to 60% [11,12]. Several circulating factors have also been identified in the serum of patients with steroid resistant and recurrent FSGS [13,14]. Disordered immune system is responsible for the pathogenesis in almost all types of glomerulonephritis (GN) including FSGS [15]. Researchers are trying to elucidate the biomarkers that can determine the etiology and prognosis of GN [16]. Davin JC [17] has very nicely discussed the role of various molecules and cells of the immune system that may be responsible for the pathogenesis of FSGS. These markers may predict steroid sensitivity or resistance and the recurrence after renal transplant.
Cytokines have important role in the pathogenesis of GN including IL2 [18]. This is the major cytokine of Th1 response that bind to heterotrimeric IL2 receptor (IL2R). It has three subunits which are IL-2rα (CD25), IL- 2rβ (CD122) and IL-2rγc (132) chains[19]. Upon activation, these receptors are upregulated on effector cells such as macrophages and B lymphocytes as well as on T cells [20,21]. IL- 2rα (CD25) is also abundantly expressed on regulatory T cells (Treg) cells) and B cells (Breg) and its scarcity has been linked to autoimmune disorders [22,23]. Moreover CD5+B cells are also involved in the pathogenesis of autoimmune disorders [24,25].
We aimed to find out the expression of CD25, CD122 and CD5 on T and B cells in blood and urine samples of patients with FSGS and their relation with response to treatment with steroids.
Materials and Methods
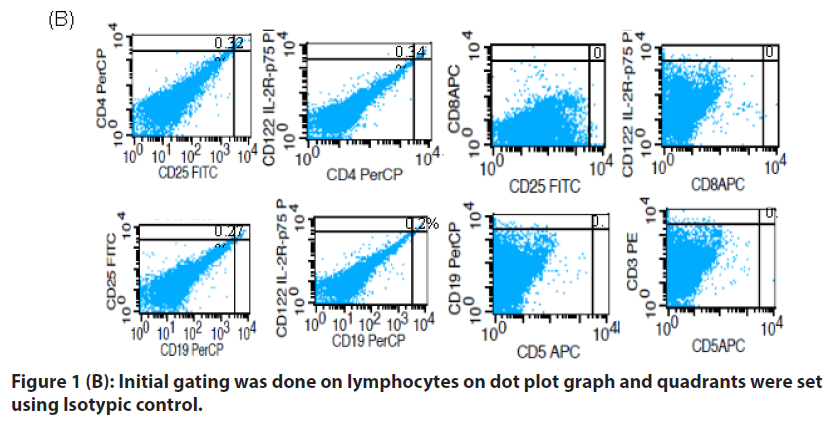
This was a pilot study in which blood and urine samples of 50 individuals were analyzed for T and B cell surface markers by flowcytometry. These markers included CD3 (pan-T cell surface marker), CD4 (helper T cell surface marker), CD8 (cytotoxic T cell marker), CD5 (T cells and subset of B cell surface marker), CD19 (B cell surface marker), CD 25 (IL-2rα) and CD 122 (IL-2rβ). Briefly 50 μl of whole blood and urine pellet were incubated with 20 μl of antibody panels. Isotypic control was made for each blood and urine sample. After incubation the cells were washed thrice with sheath fluid and then fixed with BD stabilizing and fixative reagent and analyzed on BD CellQuestTM Pro Software (BD Biosciences).
Of 50 individuals, 29 had FSGS, nine had GN other than FSGS (membranous = 6, minimal change disease = 2 and membranoproliferative GN = 1), six patients (pathological control (PC)) had urological problem including renal stones, urinary tract infection and vesicoureteral reflux and did not have GN. Six individuals were normal healthy blood donors (healthy controls (HC)).
Blood and urine samples were taken after informed consent.
Data was analyzed using spss software version 20. Fisher exact test and t-tests were applied for categorical and numerical data respectively to measure the significant difference between the variables. P ≤ 0.05 was considered significant.
The study was approved by the Ethical Review Committee of Sindh Institute of Urology and Transplantation, Karachi, Pakistan. Informed consent was taken prior to collection of samples from all patients and controls.
Results
Of total, there were 32 males and 18 females with a mean age of 23.6 ± 13 years (3.6 ± 58 years).
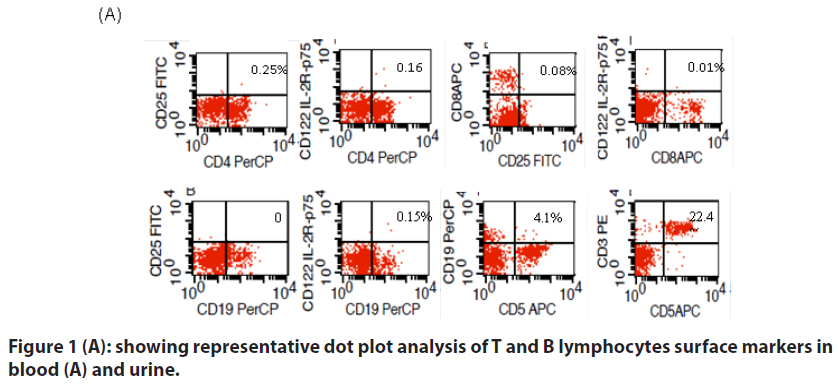
The absolute lymphocyte count and mean percentages of CD4+25+, CD4+122+, CD8+25+, CD8+122+, CD19+25+, CD19+122+,CD19+5+ and CD3+5+ in blood and urine of patients and controls are given in TABLE 1.
| FSGS2 | Other GN3 | HC4 | PC5 | P1 | P2 | P3 | |
|---|---|---|---|---|---|---|---|
| n = 29 | n = 9 | n = 6 | n = 6 | ||||
| ALC1 / µl | 3189 ± 1436 | 3807 ± 2379 | 2327 ± 979 | 2796 ± 811 | 0.349 | 0.173 | 0.524 |
| B*CD4+25+ (%) | 3.8 ± 3.3 | 5.05 ± 5.05 | 4.3 ± 2.45 | 3.92 ± 3.1 | 0.378 | 0.733 | 0.919 |
| B*CD4+122+ (%) | 0.96 ± 2.3 | 2.4 ± 6.2 | 0.000 ± 0 | 0.000 ± 0 | 0.525 | 0.317 | 0.317 |
| B*CD4+25+ | 37.6 ± 44.1 | 31.7 ± 44.0 | 100 ± 0 | 100 ± 0 | 0.728 | 0 | 0 |
| /B*CD4+122+ (%) | |||||||
| B*CD8+25+ (%) | 0.37 ± 0.84 | 0.55 ± 1.1 | 0.12 ± 0.18 | 0.02 ± 0.05 | 0.604 | 0.469 | 0.318 |
| B*CD8+122+ (%) | 4.15 ± 7.04 | 3.8 ± 6.4 | 0.75 ± 0.65 | 0.000± 0.0 | 0.896 | 0.016¶ | 0.004¶ |
| B*CD8+25+/ B*CD8+122+ (%) | 7.14 ± 25.7 | 11.2 ± 33.3 | 16.8 ± 41 | 16.7 ± 41 | 0.702 | 0.458 | 0.462 |
| B*CD8+122+/ B*CD8+25+ | 48.0 ± 50.9 | 30.9 ± 42.4 | 50.3 ± 54.0 | 0.000 ± 0 | 0.324 | 0.925 | 0.000¶ |
| B*CD19+25+ (%) | 1.01 ± 1.2 | 0.74 ± 0.84 | 0.36 ± 0.24 | 1.9 ± 4.4 | 0.543 | 0.014¶ | 0.639 |
| B*CD19+122+ (%) | 0.36 ± 0.66 | 0.30 ± 0.35 | 0.06 ± 0.14 | 0.08 ± 0.13 | 0.788 | 0.271 | 0.315 |
| B*CD19+25+/ B*CD19+122+ (%) | 22.3 ± 40.5 | 34.7 ± 49.0 | 66.8 ± 51.4 | 23.0 ± 40.5 | 0.448 | 0.025¶ | 0.967 |
| B*CD19+5+ (%) | 21.6 ± 20.6 | 17.9 ± 14.6 | 19.6 ± 19.0 | 9.4 ± 7.7 | 0.552 | 0.825 | 0.021¶ |
| B*CD19+5+/ B*CD19+ (%) | 48.1 ± 28.7 | 54.0 ± 30.5 | 49.8 ± 28.6 | 60.0 ± 25.0 | 0.595 | 0.891 | 0.351 |
| B*CD3+5+ (%) | 47.5 ± 20.0 | 50.4 ± 13.0 | 49.0 ± 11.6 | 32 ± 18.8 | 0.678 | 0.875 | 0.089 |
| U*CD4+25+ (%) | 0.61 ± 1.22 | 0.31 ± 0.7 | 0.1 ± 0.11 | 0. 5 ± 0.95 | 0.49 | 0.325 | 0.839 |
| U*CD4+122+ (%) | 0.79 ± 2.7 | 0.08 ± 0.09 | 0.07 ± 0.08 | 0.4 ± 0.83 | 0.429 | 0.515 | 0.742 |
| U*CD4+25+/ U*CD4+122+ (%) | 2.2 ± 4.7 | 1.05 ± 0.7 | 1.01 ± 0.9 | 1.07 ± 0.6 | 0.465 | 0.538 | 0.557 |
| U*CD8+25+ (%) | 0.01 ± 0.02 | 0.11 ± 0.33 | 0.000 ± 0 | 0.002±0.004 | 0.368 | 0.36 | 0.461 |
| U*CD8+122+ (%) | 0.004 ± 0.01 | 0.03 ± 0.1 | 0.000 ± 0 | 0.002±0.004 | 0.389 | 0.377 | 0.601 |
| U*CD8+25+/ U*CD8+122+ (%) | 3.6 ± 18.5 | 1.05 ± 0.7 | 0.000 ± 0 | 0.17 ± 0.41 | 0.407 | 0.639 | 0.654 |
| U*CD8+122+/ U*CD8+25+ (%) | 0.1 ± 0.28 | 0.07 ± 0.14 | 0.000 ± 0 | 0.17 ± 0.41 | 0.725 | 0.372 | 0.65 |
| U*CD19+25+ (%) | 0.5 ± 1.02 | 0.25 ± 0.51 | 0.05 ± 0.04 | 0.65 ± 1.16 | 0.468 | 0.28 | 0.77 |
| U*CD19+122+ (%) | 0.5 ± 1.0 | 0.06 ± 0.08 | 0.04 ± 0.03 | 0.5 ± 1.0 | 0.019¶ | 0.014¶ | 0.964 |
| U*CD19+25+/ U*CD19+122+ (%) | 1.07 ± 0.43 | 11.8 ± 33.1 | 1.15 ± 0.4 | 1.5 ± 0.8 | 0.357 | 0.674 | 0.099 |
| U*CD19+5+ (%) | 0.03 ± 0.12 | 0.12 ± 0.4 | 0.000 ± 0 | 0.000 ± 0 | 0.478 | 0.553 | 0.553 |
| U*CD19+5+/ U*CD19+ (%) | 10.6 ± 27.2 | 7.3 ± 22.0 | 0.000 ± 0 | 0.000 ± 0 | 0.746 | 0.045¶ | 0.045¶ |
| U*CD3+5+ (%) | 0.17 ± 0.62 | 0.11 ± 0.3 | 0.000 ± 0 | 0.000 ± 0 | 0.776 | 0.503 | 0.503 |
Table 1. Lymphocyte immunophenotypes in patients with fsgs, glomerulonephritis other than fsgs and controls.
Lymphocyte immunophenotypes in blood
There was no significant difference in the mean percentages of CD4+25+, CD4+122+, CD8+25+, CD19+122+ cells in the blood between groups of patients and controls. However the ratio of CD4+25+to CD4+122+ was found significantly low in FSGS patients compared to both HC and PC (TABLE 1). The percentages of CD8+25+ and CD8+122+ cells were high in FSGS and GN patients. However the ratio of CD8+25+ to CD8+122+ was low in FSGS patient though it did not reach the significant P-value compared to other GN and controls. Similarly the ratio of CD19+25+ to CD19+122+ cells were significantly low in FSGS compared to HC and CD19+5+ B cells were significantly high in FSGS compared to PC.
Lymphocyte immunophenotypes in Urine
Overall CD4+T cells were more than CD8+T cells in the urine of all patients and controls. Expression of CD19+25+ cells was high in FSGS compared to HC and CD19+122+ was significantly high in FSGS compared to other GN and HC. CD19+5+ B cells were absent in the urine of both controls translating into significantly high ratio of these among B cells (CD19+) in FSGS patients compared to controls.
Lymphocyte surface markers in response to steroid therapy
The FSGS patients were further classified according to their response to steroids into steroid dependent (SD-FSGS, n = 12), steroid resistant (SR-FSGS, n = 10) and steroid responsive (SRes-FSGS, n = 5), according to the definitions already described [26-28]. In two FSGS patients response to steroids could not be determined as one patient was started on steroid only I week back and in the other treatment was not started at the time of sampling.
Overall, there was no significant difference in the percentages of CD4+, CD8+ and CD19+cells with CD25 and CD122 surface markers in blood and urine of various groups of FSGS patients. CD19+5+ were found significantly high in SD- and SR-FSGS patients compared to SRes group (TABLES 2 & 3).
| SD2-FSGS3 | SR4-FSGS | SRes5-FSGS | FSGS_renal dysfunction | FSGS_normal renal functions | P1 | P2 | ||
|---|---|---|---|---|---|---|---|---|
| n = 12 | n = 10 | n = 5 | n = 5 | n= 24 | ||||
| 1 | ALC1 / µl | 3019 ± 787 | 3538 ± 2152 | 2990 ±1293 | 2141 ± 1002 | 3417 ± 1430 | 0.698 | 0.071 |
| 2 | B*CD4+25+ (%) | 4.8 ± 3.55 | 2.6 ± 2.5 | 3.1 ± 4.0 | 2.67 ± 3.2 | 4.0 ± 3.4 | 0.292 | 0.427 |
| 3 | B*CD4+122+ (%) | 1.5 ± 3.5 | 0.28 ± 0.41 | 0.58 ± 0.61 | 0.26 ± 0.58 | 1.1 ± 2.5 | 0.453 | 0.461 |
| 4 | B*CD4+25+/ B*CD4+122+ (%) | 42.8 ± 45 | 46 ± 46.9 | 22.0 ± 43.7 | 80.5 ± 43.6 | 28.7 ± 39.4 | 0.613 | 0.014¶ |
| 5 | B*CD8+25+ (%) | 0.45 ± 0.66 | 0.15 ± 0.19 | 0.8 ± 1.8 | 0.12 ± 0.19 | 0.43 ± 0.9 | 0.387 | 0.471 |
| 6 | B*CD8+122+ (%) | 5.5 ± 6.85 | 1.1 ± 1.3 | 7.7 ± 12.95 | 0.6 ± 1.13 | 4.9 ± 7.54 | 0.187 | 0.221 |
| 7 | B*CD8+25+/ B*CD8+122+ (%) | 8.5 ± 28.8 | 10.1 ± 31.6 | 0.8 ± 1.7 | 20.1 ± 44.7 | 4.44 ± 20.4 | 0.82 | 0..222 |
| 8 | B*CD8+122+/ B*CD8+25+ (%) | 46.8 ± 54.8 | 33.5 ± 46.3 | 60.1 ± 54.7 | 20.4 ± 44.5 | 54.0 ± 51.1 | 0.634 | 0.185 |
| 9 | B*CD19+25+ (%) | 0.94 ± 1.04 | 0.99 ± 0.86 | 1.65 ± 2.3 | 0.9 ± 0.9 | 1.03 ± 1.32 | 0.559 | 0.862 |
| 10 | B*CD19+122+ (%) | 0.5 ± 0.9 | 0.15 ± 0.2 | 0.6 ± 0.6 | 0.25 ± 0.26 | 0.38 ± 0.7 | 0.428 | 0.696 |
| 11 | B*CD19+25+/ B*CD19+122+ (%) | 10.5 ± 28 | 50.5 ± 52.2 | 2.3 ± 3.2 | 40.6 ± 54.2 | 18.43 ± 37.4 | 0.029¶ | 0.273 |
| 12 | B*CD19+5+ (%) | 27.8 ± 20.2 | 26.3 ± 21 | 6.02 ± 12 | 29.7 ± 19.3 | 20.0 ± 20.9 | 0.113 | 0.349 |
| 13 | B*CD19+5+/ B*CD19+ (%) | 60.7 ± 17.1 | 55 ± 26.1 | 18.5 ± 31.1 | 57.6 ± 26.2 | 46.1 ± 29.3 | 0.008¶ | 0.423 |
| 14 | B*CD3+5+ (%) | 56.8 ± 6.7 | 44.6 ± 20.1 | 26.8 ± 27.0 | 48.6 ± 17.2 | 47.3 ± 20.0 | 0.011¶ | 0.89 |
| 15 | U*CD4+25+ (%) | 0.77 ± 1.23 | 0.14 ± 0.13 | 0.98 ± 1.8 | 0.19 ± 0.16 | 0.7 ± 1.3 | 0.392 | 0.41 |
| 16 | U*CD4+122+ (%) | 0.3 ± 0.4 | 0.12 ± 0.11 | 2.8 ± 6.2 | 0.14 ± 0.8 | 0.9 ± 3.0 | 0.14 | 0.557 |
| 17 | U*CD4+25+/ U*CD4+122+ (%) | 3.3 ± 7.1 | 1.5 ± 1.4 | 1.2 ± 1.72 | 1.05 ± 0.82 | 2.5 ± 5.1 | 0.617 | 0.549 |
| 18 | U*CD8+25+ (%) | 0.01 ± 0.02 | 0.000 ± 0 | 0.2 ± 0.04 | 0.12 ± 0.03 | 0.01 ± 0.02 | 0.27 | 0.719 |
| 19 | U*CD8+122+ (%) | 0.003± 0.01 | 0.000 ± 0 | 0.01 ± 0.02 | 0.000 ± 0 | 0.005 ± 0.01 | 0.218 | 0.373 |
| 20 | U*CD8+25+/ U*CD8+122+ (%) | 3.3 ± 7.1 | 0.000 ± 0 | 0.4 ± 0.9 | 20 ± 44.7 | 0.2 ± 0.62 | 0.536 | 0.027¶ |
| 21 | U*CD8+122+/ U*CD8+25+ (%) | 0.21 ± 0.4 | 0.000 ± 0 | 0.1 ± 0.2 | 1.05 ± 0.82 | 2.5 ± 5.1 | 0.617 | 0.367 |
| 22 | U*CD19+25+ (%) | 0.73 ± 0.9 | 0.15 ± 0.15 | 0.04 ± 0.06 | 0.6 ± 1.04 | 0.5 ± 1.03 | 0.062 | 0.859 |
| 23 | U*CD19+122+ (%) | 0.7 ± 0.9 | 0.11 ± 0.1 | 0.17 ± 0.3 | 0.56 ± 1.03 | 0.5 ± 1.0 | 0.076 | 0.87 |
| 24 | U*CD19+25+/ U*CD19+122+ (%) | 1.11 ± 0.3 | 1.3 ± 0.4 | 0.6 ± 0.55 | 1.2 ± 0.3 | 1.04 ± 0.5 | 0.017¶ | 0.467 |
| 25 | U*CD19+5+ (%) | 0.06 ± 0.2 | 0.000 ± 0 | 0.02 ± 0.04 | 0.13 ± 0.3 | 0.01 ± 0.024 | 0.553 | 0.040¶ |
| 26 | U*CD19+5+/ U*CD19+ (%) | 13.7 ± 29.9 | 0.000 ± 0 | 22 ± 44.7 | 6.2 ± 13.9 | 11.5± 29.3 | 0.343 | 0.699 |
| 27 | U*CD3+5+ (%) | 0.02 ± 0.05 | 0.3 ± 1.0 | 0.04 ± 0.1 | 0.04 ± 0.08 | 0. 2 ± 0.7 | 0.506 | 0.595 |
Table 2. Comparison of lymphocyte immunophenotypes in fsgs patients in relation to response to steroids and renal functions.
| P1 (between SD2 & SR3) | P2 (between SD2 & SRes4) | P3 (between SR3 & SRes4) | |
|---|---|---|---|
| B*CD19+25/ B*CD19+122+ (%) | 0.050¶ | 0.526 | 0.017¶ |
| B*CD19+5+ (%) | 0.867 | 0.018¶ | 0.037¶ |
| B*CD19+5+/ B*CD19+ (%) | 0.544 | 0.002¶ | 0.032¶ |
| U*CD19+25+/ U*CD19+122+ (%) | 0.343 | 0.107 | 0.021¶ |
Table 3. Lymphocyte immunophenotypes with significant differences in various groups of fsgs1 patients according to response to steroids.
The FSGS patients were also grouped based on their renal functions. Five of these had renal dysfunction and 24 had normal renal functions.
There was no significant difference in CD4+25+, CD4+122+, CD8+25+ , CD8+122+, CD19+25+ and CD19+CD122+ cells in the blood and urine of patients with normal renal functions compared to those with renal dysfunction. CD19+5+ were significantly high in urine of FSGS with renal dysfunction compared to normal renal functions
Discussion
The etiology of FSGS is diverse ranging from viral infections to gene mutations. Idiopathic FSGS has a very high recurrence rate after transplantation [11] The circulating permeability factors identified so far that causes proteinuria are not specific for FSGS [13].
The presences of various immune markers and cytokine expressions have been previously studied in the biopsies of FSGS patients [17,18,29]. Recently the researchers are showing increasing interest in deducing the role of various immune cells in the pathogenesis of FSGS including T cells, B cells and macrophages to help in targeted therapy [30].
Certain cytokines including IL-2 and its receptors are important in the causation of disease severity. IL-2 signaling is required not only for activation of immune cells but also for the development of regulatory T cells [31]. For activation of T cells, IL-2 binds to high affinity IL-2R comprising of α (CD25), β (CD122) and γ (CD 132) subunits [32]. High expressions of only IL-2rα or β chains are found on regulatory T cells (Treg) [19,32]. While mutant IL2Rβ chains in mice confer protection from autoimmunity [33]. CD8 Treg cells have also been described in the literature [34] with both CD25 high, FoxP3 positive and CD122 high FoxP3 negative immunophenotypes [35,36]. The role of Tregs in FSGS pathogenesis is not very clear. Le Berre L et al showed the importance of Tregs in FSGS in their experiment on mice [37]. However Bonnani et al. [38] in their small group of pediatric patients were not able to translate this finding in humans. We have studied the expression of IL2-receptor chains on T and B lymphocytes in blood and urine of FSGS patients. In our study the ratio of CD4+25+ cells to CD4+CD122+ in blood were found significantly low in FSGS patients compared to both controls, indirectly indicating the role of decreased number of these Treg cells in its pathogenesis. On the contrary CD8+Treg cells were not significantly decreased in the blood of FSGS patients compared to controls in our study. But interestingly CD122 (IL2Rβ) was low or absent in controls compared to GN, thus pointing out that their expression increases when the T cells are activated and their increased expression later on may lead to induction of CD8 Treg cells. This can be seen translated as a higher ratio of CD8+122+ to CD8+25+ cells in SRes-FSGS compared to SD and SR and in patients with normal renal functions compared to renal dysfunction. However the values did not reach significant P-value most probably due to small number of patients.
The role of B cells in the pathogenesis of FSGS is multifaceted [29,30,39]. There is increasing evidence that B regulatory cells (Breg) with the phenotype of CD19+25+ (high) are associated with immune tolerance both in connective tissue disorders and organ transplantation. This is because of its antigen presenting characteristic to T cells rendering it immunotolerant, secretion of immunosuppressive cytokines and induction of apoptosis in inflammatory cells [23]. While CD5+B1a cells have been linked to autoimmunity [40] and has important role in IgA nephropathy [41]. We found significantly high percentage of CD5+B cells in FSGS patients compared to HC and low expression of CD19+25+ (Breg) compared to PC in our study. However we cannot establish the role of Breg in the severity of disease as expression of these cells were not low in SR FSGS or in patients with renal dysfunction. But the role of autoreactive B cells (CD19+5+) in the pathogenesis of severe disease is evident in this study as these cells were found high in the blood of SD and SR FSGS and in urine of patients with renal dysfunction.
Evaluation and validation of markers of injury in urine will certainly be more beneficial for targeted therapy and predicting disease prognosis and may save patients from repeated invasive procedures of renal biopsy. However there is a paucity of data on the expression of immune cells in urine of FSGS patients.
Extensive urinary proteomic profiling has resulted in delineation of multiple peptides responsible for disease progression such as APOA1 (apolipoprotein A-1), MXRA8 (Matrix-remodeling protein 8), uPAR or suPAR and certain cytokines that are liberated by immune cells in FSGS [42-44]. Sakatsume et al investigated immune cells in the urine of GN patients. They deduced that the inflammatory T cells and macrophages present in urine of GN patients maybe reflecting the cells infiltering the injured renal tissue rather than coming from blood [45]. This is consistent with our earlier report in which we have shown that urinary immunoglobulin concentration is independent of severity of proteinuria, indicating denovo production [46]. In our study we found an increased percentages of T and B cells in the urine of FSGS patients compared to controls with characteristically absence of CD8+ T cells in HC and CD5+B cells in the urine of both controls, indicating their relation to disease pathogenesis. However the utility of identifying these cells in urine of FSGS patients for determining response to steroid has not been established in our study.
Although previous studies have sought to characterize various immune cells in blood and urine of patients suffering from GN including FSGS, this is the first study that have looked at the expression of IL2Rα and β expression on T and B cells simultaneously in blood and urine in relation to response to steroids. Moreover this study also emphasizes on the important role of autoreactive B cells in FSGS patients which is, to the best of our knowledge, is the first report in these patients (FIGURES 1a & 1b).
Conclusions
In summary there is a definite role of T and B cells in the pathogenesis of FSGS as evident by down regulation of Treg and Breg cells in blood and upregulation of CD5+B1a cells in blood and urine of these patients. As this is a pilot study with a small sample size, therefore there is a need to do further studies on a large cohort of FSGS patients to validate these results. Furthermore, incorporating other biomarkers such as activation markers on immune cells, immune modulating cytokines and transcription factors associated with immune regulation and dysregulation in future studies on blood and urine samples and correlation with renal biopsy will give us more meaningful results in relation to disease progression. Such studies are necessary to avoid repeated invasive procedures that are sometimes required in FSGS who fail to achieve remission and develop renal failure. This will also help in planning a targeted therapy especially in patients undergoing renal transplantation without subjecting these patients to repeated graft biopsy resulting in better chances of outcome and less recurrence after transplant.
As this study was done on blood and urine samples of patients and controls, therefore minimal risk or hazards were involved. Moreover the risks associated with invasive procedure of renal biopsy were not present in this study. We did not encounter any untoward incidence during the whole period of study.
Conflict of Interest
None to declare
Acknowledgements
We are grateful for the technical assistance of Mr. Jaffer Bin Baqar with the statistical analysis.
References
- Thomas DB, Franceschini N, Hogan SL, et al. Clinical and pathologic characteristics of focal segmental glomerulosclerosis pathologic variants. Kidney Int. 69(5), 920-926 (2006).
- Rosenberg AZ, Kopp JB. Focal segmental glomerulosclerosis. Clin. J. Am. Soc. Nephrol. 12, 502-517 (2017).
- Reidy K, Kaskel FJ. Pathophysiology of focal segmental glomerulosclerosis. Pediatr. Nephrol. 22(3), 350-354 (2007).
- Rizvi SA, Manzoor K. Causes of chronic renal failure in Pakistan: a single large center experience. Saudi J. Kidney Dis. Transpl. 13(3), 376-379 (2002).
- Sprangers B, Meijers B, Appel G. FSGS: Diagnosis and diagnostic work-up. Biomed. Res. Int. 2016, 4632768 (2016).
- Hogg R, Middleton J, Vehaskari VM. Focal segmental glomerulosclerosis – epidemiology aspects in children and adults. Pediatr. Nephrol. 22(2), 183-186 (2007).
- Absar A, Asif N, Khan Q, et al. Experience of percutaneus kidney biopsy from a tertiary care center of Pakistan. Open J. Nephrol. 5, 61-66 (2015).
- Lanewala A, Mubarak M, Kazi JI, et al. A clinicopathologic study of primary focal segmental glomerulosclerosis in children. Saudi J. Kidney Dis. Transpl. 23(3), 513-520 (2012).
- Mubarak M, Kazi JI, Shakeel S, et al. The spectrum of histopathological lesions in children presenting with steroid resistant nephrotic syndrome at a single center in Pakistan. Sci. World J. 2012, 681802 (2012).
- Beins NT, Dell KM. Long-term outcomes in children with steroid-resistant nephrotic syndrome treated with calcineurin inhibitors. Front Pediatr. 3, 104 (2015).
- Maas RJ, Deegens JK, van den Brand JA, Cornelissen EA, Wetzels JF. A retrospective study of focal segmental glomerulosclerosis: clinical criteria can identify patients at high risk for recurrent disease after first renal transplantation. BMC Nephrol. 14, 47 (2013).
- Kang HG, Ha IS, Cheong HI. Recurrence and treatment after renal transplantation in children with FSGS. Biomed Res. Int. 2016, 6832971 (2016).
- Wada T, Nangaku MA circulating permeability factor in focal segmental glomerulosclerosis: the hunt continues. Clin. Kidney. J. 8(6), 708-715 (2015).
- Suresh CP, Saha A, Kaur M, et al. Differentially expressed urinary biomarkers in children with idiopathic nephrotic syndrome. Clin. Exp. Nephrol. 20, 273-283 (2016).
- Mathieson PW. What has the immune system got against the glomerular podocyte? Clin. Exp. Immunol. 134(1), 1-5 (2003).
- Caliskan Y, Kiryluk K. Novel Biomarkers in Glomerular Disease. Adv. Chronic Kidney Dis. 21(2), 205-216 (2014).
- Davin JC. The glomerular permeability factors in idiopathic nephrotic syndrome. Pediatr. Nephrol. 31(2), 207-215 (2016).
- Yoh K, Kobayashi M, Yamaguchi N, et al. Cytokines and T-cell responses in superantigen-related glomerulonephritis following methicillin-resistant Staphylococcus aureus infection. Nephrol. Dial. Transplant. 15(8), 1170-1174 (2000).
- Nelson BH. IL-2, regulatory T cells, and tolerance. J. Immunol. 172(7): 3983-3988 (2004).
- Krieg C, Létourneau S, Pantaleo G, et al. Improved IL-2 immunotherapy by selective stimulation of IL-2 receptors on lymphocytes and endothelial cells. Proc. Natl. Acad. Sci. USA 107(26), 11906-11911 (2010).
- Suzuki T, Cooper MD. Comparison of the expression of IL 2 receptors by human T and B cells: induction by the polyclonal mitogens, phorbol myristate acetate, and anti-mu antibody. J. Immunol. 134(5), 3111-3119 (1985).
- Kubach J, Lutter P, Bopp T, et al. Human CD4+ CD25+ regulatory T cells: proteome analysis identifies galectin-10 as a novel marker essential for their anergy and suppressive function. Blood. 110(5), 1550-1558 (2007).
- Wortel CM, Heidt S. Regulatory B cells: Phenotype, function and role in transplantation. Transpl. Immunol. 41, 1-9 (2017).
- Hayakawa K, Asano M, Shinton SA, et al. Positive selection of anti-thy-1 autoreactive B-1 cells and natural serum autoantibody production independent from bone marrow B cell development. J. Exp. Med. 197(1), 87-99 (2003).
- Hardy RR. B-1 B cell development. J. Immunol. 177, 2749-2754 (2006).
- Sinha MD, MacLeod R, Rigby E, Clark AG. Treatment of severe steroid-dependent nephrotic syndrome (SDNS) in children with tacrolimus. Nephrol. Dial. Transplant. 21(7), 1848-1854 (2006).
- Chen SY, Wu CY, Tsai IJ, Tsau YK. Treatment course of steroid-dependent nephrotic syndrome: emphasized on treatment effect. Nephrology (Carlton). 15(3), 336-339 (2010).
- Lombel RM, Gipson DS, Hodson EM. Treatment of steroid-sensitive nephrotic syndrome: new guidelines from KDIGO. Pediatr. Nephrol. 28, 415-426 (2013).
- Yildiz B, Cetin N, Kural N, et al. CD19 + CD23+ B cells, CD4 + CD25+ T cells, E-selectin and interleukin-12 levels in children with steroid sensitive nephrotic syndrome. Ital. J. Pediatr. 39, 42 (2013).
- Kronbichler A, Leierer J, Oh J, et al. Immunologic changes implicated in the pathogenesis of focal segmental glomerulosclerosis. Biomed. Res. Int. 2016, 2150451 (2016).
- Cerosaletti K, Schneider A, Schwedhelm K, et al. Multiple autoimmune-associated variants confer decreased IL-2R signaling in CD4 (+) CD25 (hi) T cells of type 1 diabetic and multiple sclerosis patients. PLoS One. 8, e83811 (2013).
- Malek TR, Castro I. Interleukin-2 receptor signaling: At the interface between tolerance and immunity. Immunity. 33, 153-165 (2010).
- Yu A, Zhu L, Altman NH, et al. A low interleukin-2 receptor signaling threshold supports the development and homeostasis of T regulatory cells. Immunity. 30, 204-217 (2009).
- Gutiérrez-Hoya A, López-Santiago R, Vela-Ojeda J, et al. Role of CD8 regulatory T cells versus Tc1 and Tc17 cells in the development of human graft-versus-host disease. J. Immunol. Res. 2017, 1236219 (2017).
- Liu J, Chen D, Nie GDet al. CD8 (+) CD122 (+) T-Cells: A newly emerging regulator with central memory cell phenotypes. Front Immunol. 6, 494 (2015).
- Muthu Raja KR, Kubiczkova L, Rihova L, et al. Functionally suppressive CD8 T regulatory cells are increased in patients with multiple myeloma: a cause for immune impairment. PLoS One. 7(11), e49446 (2012).
- Le Berre L, Bruneau S, Naulet J, et al. Induction of T regulatory cells attenuates idiopathic nephrotic syndrome. J. Am. Soc. Nephrol. 20(1), 57-67 (2009).
- Bonanni A, Bertelli R, Rossi R, et al. A pilot study of IL2 in drug-resistant idiopathic nephrotic syndrome. PLoS One. 10(9), e0138343 (2015).
- Chan CY, Liu ID, Resontoc LP, et al. T lymphocyte activation markers as predictors of responsiveness to Rituximab among patients with FSGS. Clin. J. Am. Soc. Nephrol. 11(8), 1360-1368 (2016).
- Youinou P, Lydyard PM. CD5+ B cells in nonorgan-specific autoimmune diseases: a fresh look. Lupus. 10(8), 523-525 (2001).
- Yuling H, Ruijing X, Xiang J, et al. CD19+CD5+ B Cells in Primary IgA Nephropathy. J. Am. Soc. Nephrol. 19(11), 2130-2139 (2008).
- Kalantari S, Nafar M, Rutishauser D, et al. Predictive urinary biomarkers for steroid-resistant and steroid-sensitive focal segmental glomerulosclerosis using high resolution mass spectrometry and multivariate statistical analysis. BMC Nephrol. 15, 141 (2014).
- Huang J, Liu G, Zhang YM, et al. Urinary soluble urokinase receptor levels are elevated and pathogenic in patients with primary focal segmental glomerulosclerosis. BMC Med. 12, 81 (2014).
- Varghese SA, Powell TB, Budisavljevic MN, et al. Urine biomarkers predict the cause of glomerular disease. J. Am. Soc. Nephrol. 18(3), 913-922 (2007).
- Sakatsume M, Xie Y, Ueno M, et al. Human glomerulonephritis accompanied by active cellular infiltrates shows effector T cells in urine. J. Am. Soc. Nephrol. 12(12), 2636-2644 (2001).
- Anis S, Parveen J, Musharraf W, et al. Can we use serum and urine immunoglobulin levels as biomarkers in patients with glomerulonephritis? Immunopathol. Persa. 3, e10 (2017).
