Research Article - Interventional Cardiology (2022) Volume 14, Issue 3
Frame fracture frequency and heatmap distribution during follow-up of the GORE Cardioform ASD device
- Corresponding Author:
- Gareth J Morgan
School of Medicine, University of Colorado, Anschutz Medical Campus, Colorado, USA,
E-mail: drgarethjmorgan@gmail.com
Received date: 05-Apr-2022, Manuscript No. FMIC-22-59543; Editor assigned: 07-Apr -2022, PreQC No. FMIC-22-59543 (PQ); Reviewed date: 25-Apr-2022, QC No. FMIC-22-59543; Revised date: 02-May-2022, Manuscript No. FMIC-22-59543 (R); Published date: 09-May-2022, DOI: 10.37532/1755-5310.2022.14(3).505
Abstract
Objective: To evaluate the frequency and characteristics of Gore Cardioform ASD Device Frame Fractures (FF) and explore the most susceptible locations for these events.
Background: The latest device approved by the FDA for Atrial Septal Defect (ASD) closure is the GORE® Cardioform ASD occluder (GCA). Despite a very low incidence of complications directly impacting patient well-being, a significant amount of FFs have been observed in the GCA at short to medium-term follow-up.
Methods: We performed a retrospective single-center chart review of 38 patients who received a GCA in whom a 6-month fluoroscopic follow-up was performed. We assessed the number and type of fractures and devised a simple nomenclature system based on a Three-Dimensional (3D) reconstruction of the device’s fluoroscopic images. We also translated these systems to a basic fluoroscopy setting to be applied without the need of a complex 3D system.
Results: The FF incidence in our population was 40% at a 6-month follow-up. By 3D evaluation, the most common anatomical position for fractures was the anteroinferior quadrant. At the time of manuscript submission, no echocardiographic or clinical sequelae were noted in our population. Factors statistically associated with FF were the size of the defect and the size of the device implanted.
Conclusion: The incidence of frame fractures in our population was higher than that observed in published literature, albeit using more intense image scrutiny than that required by other cited studies. We noted that the central portion of the left atrial disc was the most susceptible to FF.
Keywords
Congenital heart disease • Atrial septal defect • Transcatheter closure
Abbreviations
ASD: Atrial Septal Defect; FF: Frame Fracture; GCA: GORE® CARDIOFORM ASD occluder IFU: Instructions For Use; LPO: Left Posterior Oblique; RPO: Right Posterior Oblique; 3D: Three Dimensional
Introduction
Interventional cardiac techniques are employed to treat approximately 75% of clinically significant secundum Atrial Septal Defects (ASD’s). Percutaneous closure has been adopted as the preferred modality based on numerous studies describing excellent short- and long-term safety and efficacy [1-3].
As percutaneous closure has gained popularity, multiple technical innovations (i.e., materials, device design, and delivery systems) have been implemented to improve clinical results and broaden the reach of percutaneous closure methods, in an attempt to limit the need for open surgical repair [4,5].
The GORE® CARDIOFORM ASD occluder (GCA) was approved by the FDA in 2019, this device consists of two discs covering the ASD on each septal surface, connected by a compressible, conformable waist. The device frame comprises multiple platinumfilled nitinol wires, covered on each side by expanded polyurethane, producing a softer, more malleable device than other commercially available options [6,7].
No erosions have been reported with the GCA in clinical trial data and early commercial use reports. Overall, few complications have been described in short to medium-term follow-up, suggesting a good comparable safety profile. Despite this, a significant number of Frame Fractures (FF) have been noted on fluoroscopic imaging, which was mandated as part of the clinical trial follow-up [8]. Although so far, no clinical relevance has been noted for FF, it is at least a cause for pause and consideration when approximately a third of devices develop unanticipated FF within six months of implantation [8-12].
This lack of information on the description of FF in GCA prompted us to evaluate the occurrence of FF in our patients, the spatial location of these fractures, and special patterns that can be correlated with clinical outcomes.
Materials and Methods
Study design
This is a retrospective single-center study based on chart reviews of patients who underwent transcatheter ASD closure between January 2017 and June 2021. All patients who received a GCA and 6-month post-implantation fluoroscopy were included.
FF was defined as discontinuity of wireframe with or without displacement of the fractured wire ends visualized on fluoroscopic imaging performed as part of the ASSURED study follow-up. As such, some of the data described in our cohort has been reported as part of the ASSURED study manuscripts [8].
The parameters assessed at baseline were: Defect size, aortic rim, septal length, device size, and those assessed at 6-month follow were: Presence of fractures, number of fractures, and location of fractures determined by 3D assessment of the implanted device. Patient demographic and clinical characteristics were also collected.
Procedure details
Device closure procedures were all performed by one of 3 attending interventional cardiologists. All of them were co-investigators in the GORE ASSURED study and had specific training in this particular device’s implantation. There were no significant procedural or post-procedural complications in our patient cohort. Device sizing was performed based on a combination of threedimensional trans-esophageal echocardiography with stop-flow balloon sizing. Device size choice was at the operators’ discretion but always guided by the manufacturer’s Instructions For Use (IFU) in the context of the ASSURED study protocol [8].
Patients returned for fluoroscopic follow-up as per protocol for the ASSURED study protocol. As part of this, we performed a high-resolution fluoroscopic rotation; through approximately 210 degrees from a Right Posterior Oblique (RPO) to Left Posterior Oblique (LPO) projection.
Fracture assessment
We used three spatial descriptors to compile a system for the classification of Frame Fractures (FF):
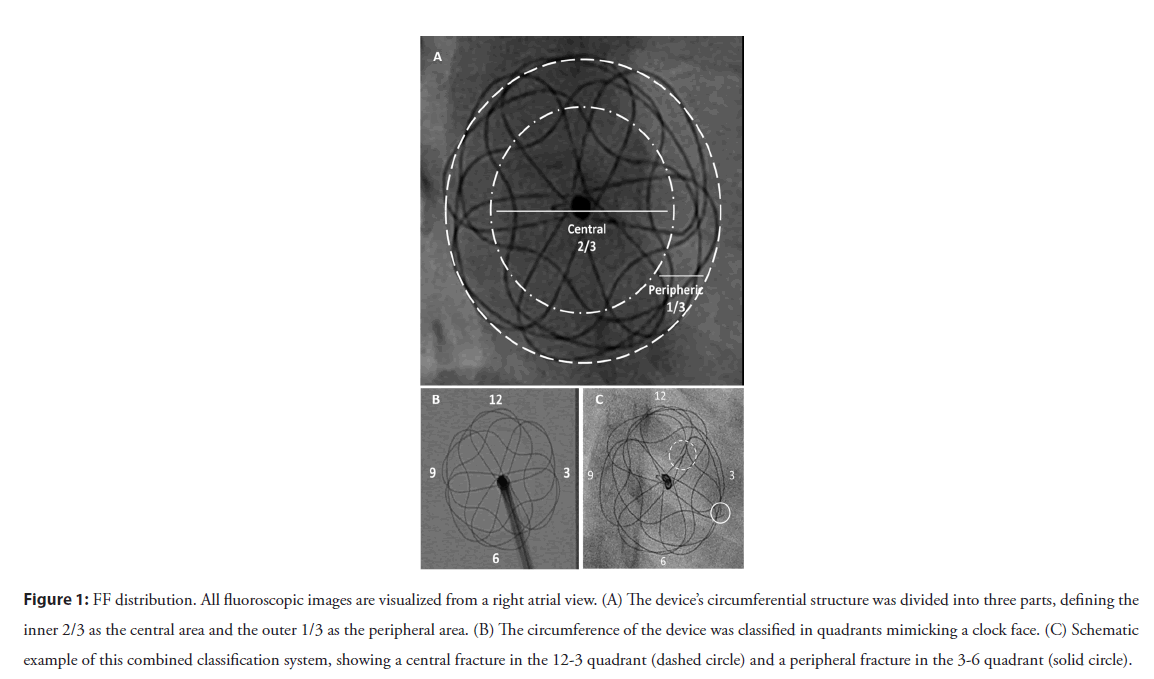
1. Based on radial distribution, FFs were described as central if they were within the inner two-thirds and peripheral if they were within the outer third of the device frame.
2. Fracture position was described based on quadrants, dividing the areas as per a clock face. These quadrants were labeled based on the right atrial fluoroscopic aspect and are illustrated in Figure 1. For consistency of discussion, we labeled features of the left atrial portion of the devices with a negative polarity sign and the right atrial portion with a positive polarity.
Figure 1: FF distribution. All fluoroscopic images are visualized from a right atrial view. (A) The device’s circumferential structure was divided into three parts, defining the inner 2/3 as the central area and the outer 1/3 as the peripheral area. (B) The circumference of the device was classified in quadrants mimicking a clock face. (C) Schematic example of this combined classification system, showing a central fracture in the 12-3 quadrant (dashed circle) and a peripheral fracture in the 3-6 quadrant (solid circle).
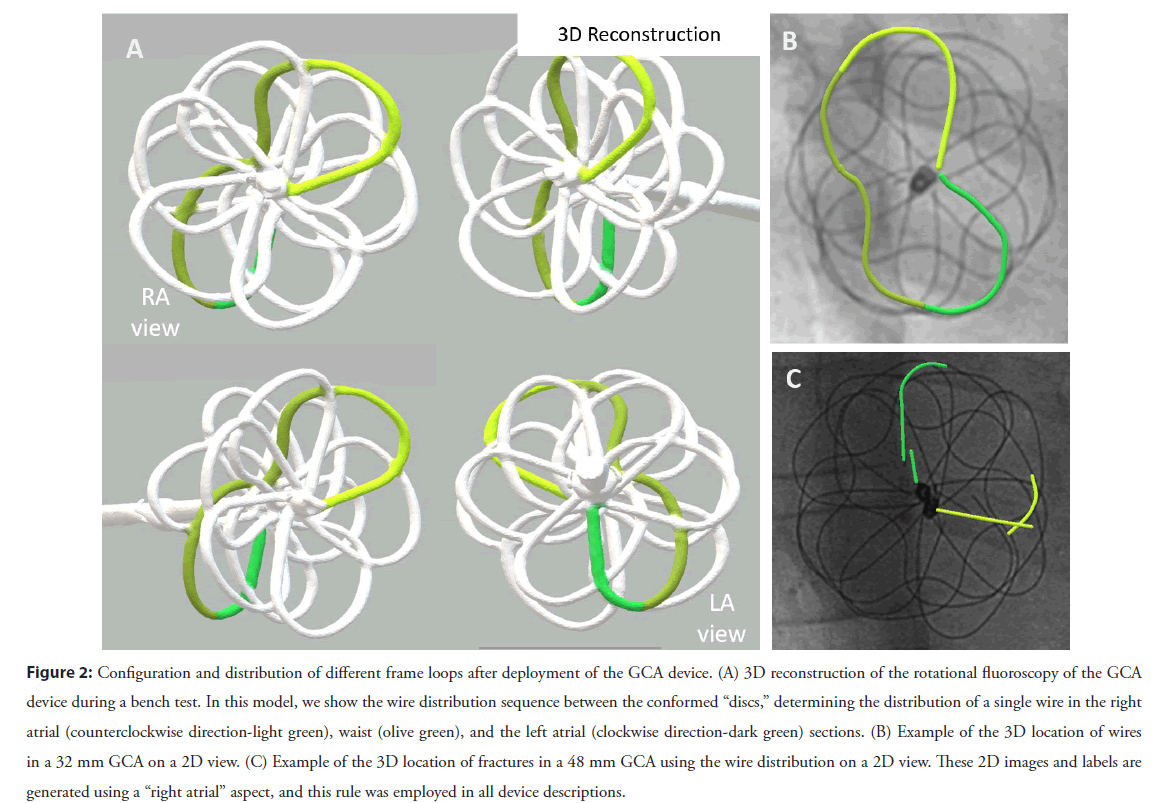
3. The third component of the system allowed us to determine which atrial disc (or, more accurately, which side of the atrial septum) the fracture had occurred. For this, we performed a 3D rotational fluoroscopy during GCA implantation into a plastic support jig, intending to mimic the real process of delivery and unfurling of the device across the atrial septum. A 3D reconstruction was subsequently generated and used to identify which wire structures would lie on which side of the septum. We then overlaid that onto 2D views to allow us to establish in each patient which parts of each individual wire lay to the left or the right of the plane of the atrial septum. This process is illustrated in Figure 2 and was crucial to our understanding of the fracture position given the GCA’s convoluted 3D construct. More details about 3D reconstruction from rotational fluoroscopy and overlaying onto 2D images have been previously published by our group [13-15]
Figure 2: Configuration and distribution of different frame loops after deployment of the GCA device. (A) 3D reconstruction of the rotational fluoroscopy of the GCA device during a bench test. In this model, we show the wire distribution sequence between the conformed “discs,” determining the distribution of a single wire in the right atrial (counterclockwise direction-light green), waist (olive green), and the left atrial (clockwise direction-dark green) sections. (B) Example of the 3D location of wires in a 32 mm GCA on a 2D view. (C) Example of the 3D location of fractures in a 48 mm GCA using the wire distribution on a 2D view. These 2D images and labels are generated using a “right atrial” aspect, and this rule was employed in all device descriptions.
Heat map design
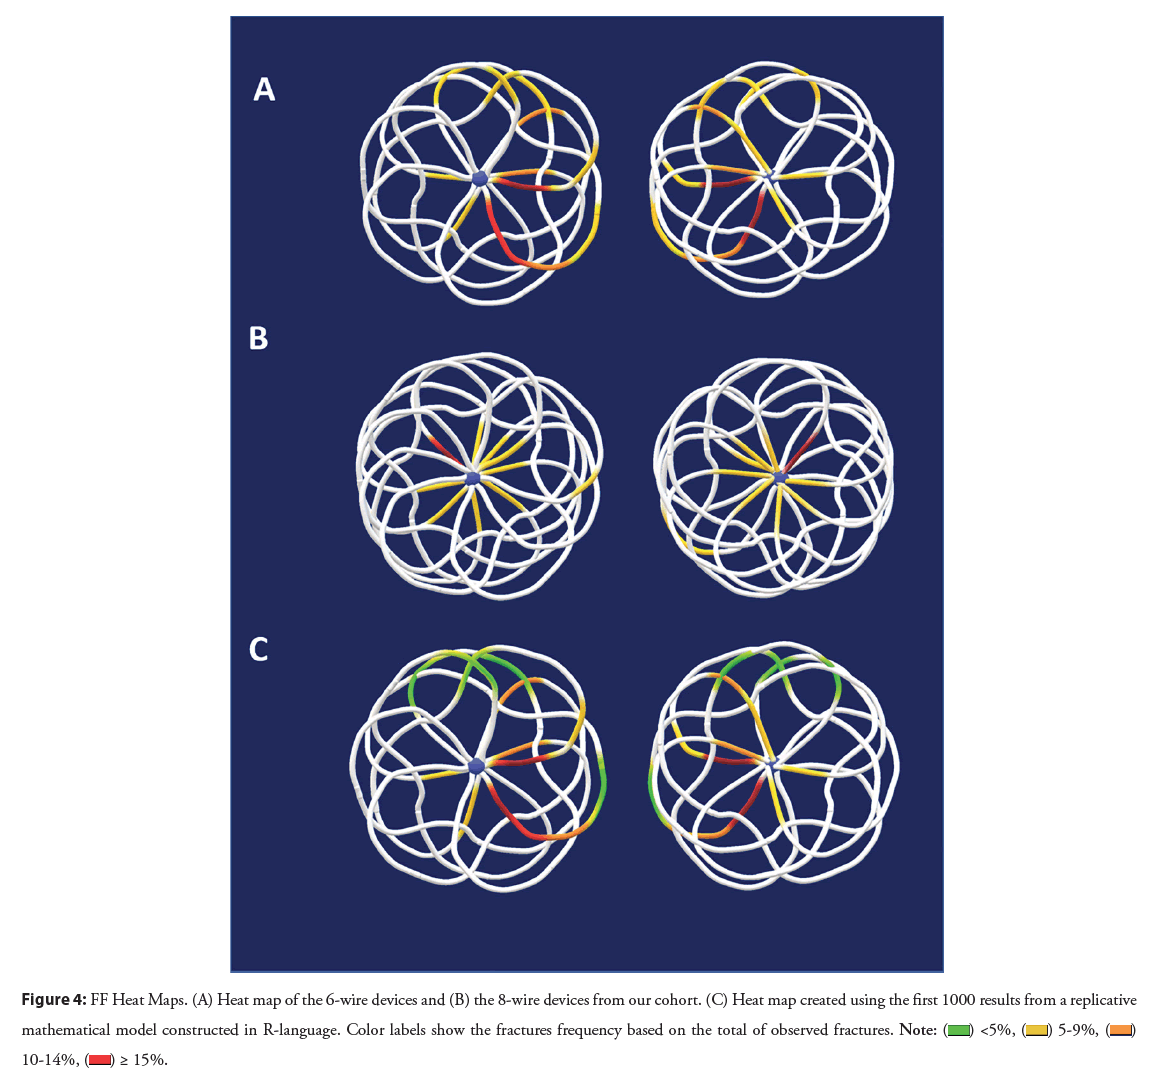
After developing three-dimensional reconstructions of the GCA devices, we defined the areas of the device as coordinates (Figure S1). Subsequently, with the information collected from all the FFs seen in our cohort, we described the presence of fractures in each coordinate for each device. Each evaluated GCA with fractures was graphically represented (Figure S2). All these affected coordinates in all the GCAs were combined into heat maps, which took into account that the smaller devices (27, 31, 37 mm) are constructed from 6 wires, and the larger GCA devices (44 mm and 48 mm) are made with 8 wires.
Since the vast majority of the fracture observations occurred in our 6 wire (smaller device) group, we created and trained a model with this data using R language (see subsequent “statistical analysis” section). The objective was to explore and validate our heat map regarding fracture susceptibility at each coordinate point in the GCA structure. The model tested each coordinate as a binary variable (answering the question of whether fractures occurred or not). Using bootstrapping techniques, several possible permutations were combined, encompassing all possible evaluable events within our data.
To graphically represent these results, similar to our device observations, we created a combined model on a heat map of all the GCAs with fractures among the first 1000 combinations created by our computational model [16].
Statistical analysis
For statistical analysis patients were grouped according to the presence of WFF as fracture vs. non-fracture, and the number of wires forming the device frame as 6-wires vs. 8-wires.
Categorical data were summarized by frequency and percentage. Continuous data were presented by median and interquartile range. Association for categorical data was evaluated using the Pearson’s χ2 test, and the difference between groups of continuous variables was measured with the Mann-Whitney U test.
Statistical analyses were performed using SPSS version 28 (IBM software group, Chicago, Illinois) and R version 4.1.0 using the packages heatmap and volcanoplot (cran.r-project.org).
Results
Patient data were collected between January 2017 and June 2021. Of fifty-four subjects, thirty-eight had a high-resolution fluoroscopic rotation and could be evaluated. At 6-month followup, no clinical or echocardiographic complications were reported. Baseline and procedure characteristics are summarized in Table 1.
| Baseline and procedure characteristics in relation to frame fracture frequency | ||||
|---|---|---|---|---|
| Total (N=38) | Fracture (n=15) | Non-fracture (n=23) | p value | |
| Patients characteristics | ||||
| Female | 31 (81.6%) | 13 (86.7%) | 18 (90%) | 0.514 |
| Age, median (IQR), years | 5 (8) | 6 (11) | 4.5 (5.3) | 0.148 |
| Age ≤ 10 years | 26 (68.6%) | 8 (53.3%) | 18 (78.2%) | 0.106 |
| Age>10 years | 12 (31.45) | 7 (46.7%) | 5 (21.7%) | |
| BSA, m2 | 0.8 (0.6) | 0.9 (0.9) | 0.7 (0.9) | 0.074 |
| BMI, kg/m2 | 15.4 (5.1) | 16.7 (7.2) | 15.4 (2.8) | 0.633 |
| ASD Characteristics | ||||
| Stop flow diameter, mm | 16 (5.2) | 19 (5.7) | 15.2 (3.9) | 0.008 |
| Stop flow diameter, ≤ 18 mm | 24 (65.7%) | 6 (40%) | 19 (82.6%) | 0.010 |
| Stop flow diameter, >18 mm | 13 (34.3%) | 9 (60%) | 4 (17.4%) | |
| Septal length, mm | 34.9 (8.6) | 36 (9.2) | 32.5 (7.3) | 0.251 |
| Aortic rim, mm | 3.9 (3.8) | 4 (4) | 3.5 (3.5) | 0.837 |
| Multiple fenestration | 7 (20%) | 2 (14.3%) | 5 (25%) | 0.672 |
| GORE Cardioform Septal Occluder | ||||
| Size, mm | 32 (5) | 37 (5) | 32 (0) | 0.011 |
| Device to defect size ratio | 2:1 (0.5) | 2.1:1 (0.7) | 1.9:1 (0.3) | 0.064 |
| Device to septal length ratio | 0.5:1 (0.2) | 0.5:1 (0.1) | 0.4:1 (0.2) | 0.169 |
| Device to BSA ratio | 20.4:1 (10.9) | 20.7 (13) | 20.4 (10.9) | 0.987 |
| Residual defect | 7 (18.4%) | 4 (26.6%) | 3 (13%) | 0.43 |
| Impingement of nearby structure | 1 (2.63%) | 1 (6.7%) | 0 (0%) | NA |
Note: Values are displayed as medians with Inter Quartile Range (IQR), or numbers affected (n) with numbers as a percentage of the cohort (%). Abbreviations: BSA: Body Surface Area; BMI: Body Mass Index; IFU: Instructions For Use
Table 1: Baseline and procedure characteristics.
Of the thirty-eight GCA devices, 40% (15/38) were found to have FF. All of these were found at routine 6-month fluoroscopic follow-up.
Frame fractures
Of the 15 devices with FF, single fractures were noted in 46.6%, and multiple fractures were described in the remaining 53.3%. The proportion of fractures by the size of the implanted device was 28.6% in the 27 mm devices (2/7), 16.7% for 32 mm devices (3/18), 77.8% for 37 mm devices (7/9), 66% in 44 mm devices (2/3), and 100% for 48 mm devices (1/1).
When fractures were evaluated as individual events, a total of 31 FF were described in the 15 affected devices. For the 6-wire device group, 35.3% of devices had FF (12/34), with a total of 20 fractures. Regarding their location in the devices, 55% were central and 35% peripheral. By quadrants, 80% were located in the 2 quadrants between 12 and 6 o’clock, largely concentrated in the quadrant between 3 and 6 o’clock. Concerning the affected disc, 60% of the fractures in this group were in the right atrial disc, and the remaining 40% were in the left atrial disc.
For the 8-wire devices, the overall number of devices and hence FF observations is relatively small, hence statistical interpretation in this sub-group analysis should be guarded. Three of the 4 implanted 8 wire devices had FFs, with a total of 11 fractures. FFs were centrally in the majority of cases (88.9%), with an approximately equal distribution by quadrants (18.1 to 27%). In this group, the left disc was affected in 81.8% of cases, and the remaining 18.2% were in the right disc. These findings are summarized in Figures 3 and 4. These results are summarized on Table 2.
Figure 3: FF distribution by quadrant and anatomical location. (A) Distribution of fractures observed in 4 quadrants for the 6-wire device. Using a virtual 3D model of the 6-wire GCA, constructed from 3DRA imaging, we superimposed the (B) RA and the (C) LA discs onto an anatomical model to help visualize the fractures’ position. (D) Distribution of fractures observed in 4 quadrants for the 8-wire device. (E,F) anatomical model using the 8-wire GCA 3D model. Abbreviations: SVC: Superior Vena Cava; IVC: Inferior Vena Cava; CS: Coronary Sinus; MV: Mital Valve; RA: Right Atrial; LA: Left Atrial.
Figure 4: FF Heat Maps. (A) Heat map of the 6-wire devices and (B) the 8-wire devices from our cohort. (C) Heat map created using the first 1000 results from a replicative
mathematical model constructed in R-language. Color labels show the fractures frequency based on the total of observed fractures. 

| Total fractures identified (n=31) in 15 patients | |||
|---|---|---|---|
| Total | 6-wires devices | 8-wires devices | |
| Right atrial disc | 14 (45.2%) | 12 (60.0%) | 2 (18.2%) |
| Central | 9 (64.3%) | 8 (66.6%) | 1 (50%) |
| Peripheral | 5 (35.7%) | 4 (33.3%) | 1 (50%) |
| Left atrial disc | 17 (54.8%) | 8 (40.0%) | 9 (81.8%) |
| Central | 11 (64.7%) | 3 (37.5%) | 8 (88.8%) |
| Peripheral | 6 (35.3%) | 5 (62.5%) | 1 (11.1%) |
Note: Values are displayed as numbers affected (n) with numbers as a percentage of the group (%). Central=fracture present in the inner 2/3 of the device (on an enface view of the discs), Peripheral=fracture present in the outer 1/3 of the device (on an enface view of the discs)
Table 2: Fracture locations.
Heat map
The combined occurrence of fractures was plotted in the respective models, confirming that fractures in the right atrial disc in the anteroinferior quadrant were the most frequent location for 6-wire devices. In contrast, for the 8-wire devices, fractures were evenly distributed.
Using our data from 6-wire devices, the replicated model showed an expected occurrence for fractures in 43.5% of all our experiments. The most susceptible areas for fractures were similar to those plotted in the observed model. These models are illustrated in Figure 4.
Additional findings
Factors associated with FF: Data from the fifteen devices with fractures were compared with data from those devices without fractures. Variables significantly associated with FF were an ASD stop-flow diameter >18 mm (p=0.010), and device size >32 m (p=0.011). The rest of variables did not present a statistical difference between groups.
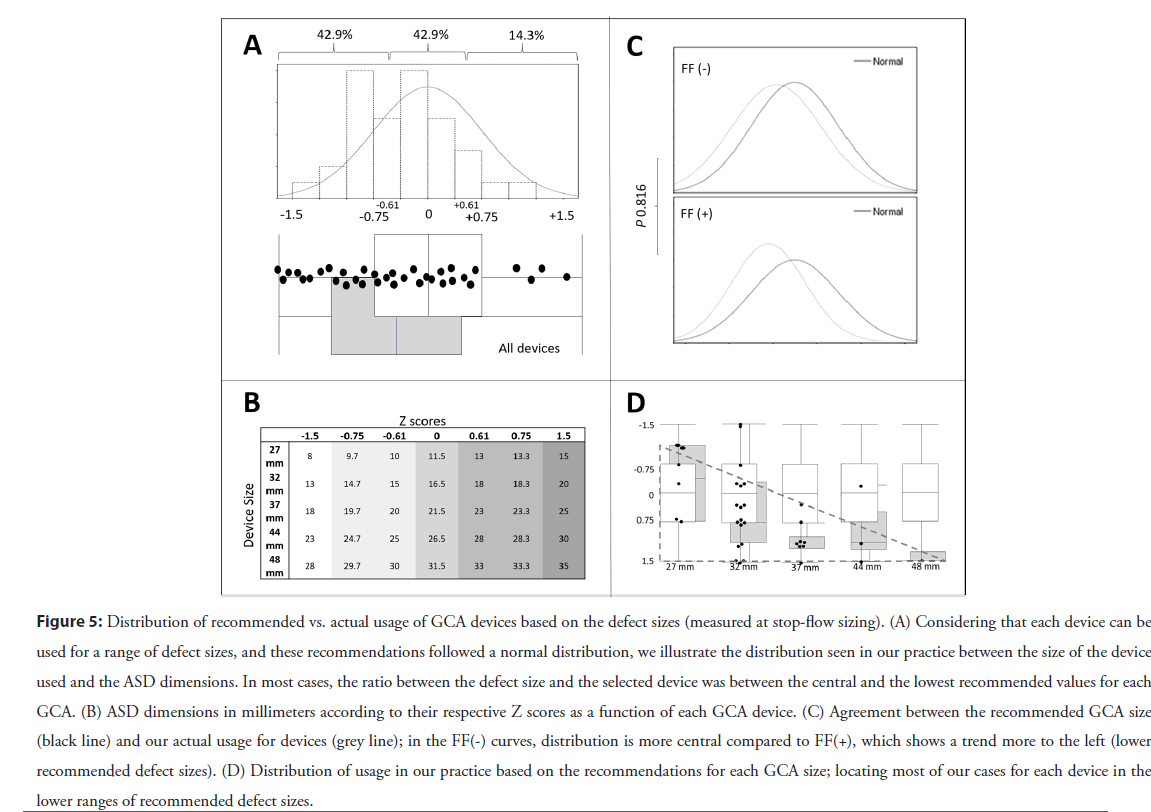
Device selection: The GCA sizing range developed by the manufacturer follows a normal distribution that encompasses defects sizes 1.5 standard deviations away from the mean (Figure S1). Therefore, when we consider which GCA device sizes are recommended from the IFU based on defect dimensions (Figure 3) for ASDs between 13 and 30 mm, two different device sizes are recommended as suitable to close any measured defect. For example, for an ASD with a stop flow diameter of 14 mm, a 27 mm or 32 mm GCA are within range, meaning that a physically “looser” relationship would exist between the cardiac anatomy and the 27 mm device than that induced with implantation of a 32 mm GCA device.
In our practice (amongst three operators) in this cohort, when the choice of device size was within the range indicated by the IFU, we tended to use the bigger of the 2 devices recommended (76.3%, 29/38). Nevertheless, the tendency towards a larger device to defect size ratio in our cohort was not statistically associated with FF’s during our evaluation (p=0.816). These findings are summarized in Figure 5 and explained in more detail in Figure S3.
Figure 5: Distribution of recommended vs. actual usage of GCA devices based on the defect sizes (measured at stop-flow sizing). (A) Considering that each device can be used for a range of defect sizes, and these recommendations followed a normal distribution, we illustrate the distribution seen in our practice between the size of the device used and the ASD dimensions. In most cases, the ratio between the defect size and the selected device was between the central and the lowest recommended values for each GCA. (B) ASD dimensions in millimeters according to their respective Z scores as a function of each GCA device. (C) Agreement between the recommended GCA size (black line) and our actual usage for devices (grey line); in the FF(-) curves, distribution is more central compared to FF(+), which shows a trend more to the left (lower recommended defect sizes). (D) Distribution of usage in our practice based on the recommendations for each GCA size; locating most of our cases for each device in the lower ranges of recommended defect sizes.
Discussion
This study evaluated the incidence and physical distribution of FF at 6-month follow-up after GCA device implantation as part of the ASSURED study. We explored potential clinical implications and identified and investigated patient, device, and procedural factors associated with these events. Our results show a slightly higher incidence of FF than reported in other studies [8].
Factors statistically associated with FF were both the defect and the implanted device’s size. As per the latest follow-up data from our cohort, no clinical implications related to FF were found.
Frame fracture incidence in our population was 40% at 6-months follow-up. Compared with the incidence reported in other studies of this device, this value was slightly higher than expected (25% to 36%) [8,11].
Among factors investigated in our study, there was a significant difference in implanted device size, as well as defect size between FF and non-FF sub-cohorts. These results are in keeping with previous FF descriptions, which detail the relationship between the device implanted and the size of the defect as a surrogate for the mechanical stress forces placed on the device by the beating heart [8,17].
Linked to this, it is assumed that due to the GCA’s physical design characteristics, the conformation of the device after delivery is, in part, determined by the geometrical shape of the atrial septal defect and the nature of the tissue rims. The device has been designed to adapt to the heart’s anatomy and not vice versa, achieving better compliance during the cardiac cycle. This concept is at least in part engineered to decrease erosion potential, but theoretically, mainly when oversized devices are implanted, this process could increase the chronic risk of frame fractures [11].
Intriguingly, in our clinical practice, device selection based on the size of the defect showed a tendency towards the use of relatively bigger devices. We had an increased incidence of device fracture compared with other published data, which tentatively supports the notion that a higher device to defect ratio increases fracture occurrence. Of note, though, we found no direct relationship in our cohort between the ratio of device size to defect size and risk of frame fractures; not supporting this assertion.
The central portion of the device was described as the predominant location for fractures, suggesting that like previous observations for the GCA and Gore Septal Occluder devices, there remains residual tension in the frame structure acquired during the Nitinol wire shaping, and in the setting of the constraint of a relatively large device in a relatively small defect, that tension could be increased.
Moreover, when fracture position related to anatomical structures was evaluated, we identified that the anteroinferior quadrant was the most common position for FF, followed by the anterosuperior position in the left atrium. This raises the possibility that fracture susceptibility could be related to differences in interaction between the device and the cardiac anatomy’s specific morphological features. One could theorize about the kinetic stress placed on the anterior portions of both the right and left atrial components. The motion and distortion of the device as it splays around the pulsatile aortic indentation may contribute to the increased fracture prevalence. However, this is pure speculation, which should perhaps be tested by computer modeling and finite element analysis [18,19].
Despite the fact that different factors are being proposed to help hypothesize the trigger for FF development, fractures in the GCA device have not been associated with adverse clinical outcomes. The only isolated reports of the negative effects of FF on patient outcomes were seen in earlier iterations of the GORE device range; hence the clinical implication of fractures in the GCA is unclear. It is, in some respects challenging to establish whether frame fracture is a real adverse event. Furthermore, the presence of fractures in our cohort was only detected on high frame rate, high dose fluoroscopy, not noted on echocardiography or chest radiograph, the two modalities used by most implanters as follow-up determinants for patients without clinical symptoms or signs. Despite this important caveat, our results detail a practical guideline to classify fractures and bring additional information into a discussion regarding device safety.
Interestingly, with the introduction of the newer GORE devices, the description of softer and more malleable devices with a more robust wireframe suggests a desire to decrease the frame fracture incidence compared with the old GORE HELEX. Despite this, the initial experience reported with these new devices has yielded a higher fracture frequency than previously detailed [17].
Conclusion
The incidence of fractures in our population was slightly higher than that observed in published literature; however, these did not produce any clinical sequelae. It is important to note that fractures in our cohort were identified using more intensive imaging protocols and novel image scrutiny than that required in the cited studies. We noted that the central portion of the anteroinferior quadrant of the right atrial disc was the most susceptible to FF and found that the defect size and the device size were the only statistically associated factors.
Study Limitations
This study’s single-center retrospective nature limits our observations to a reduced number of subjects, limiting the power to generalize our findings. Among possible evaluations intended for our data, the ideas of creating correlation models and building a predictive model with the statistically significant (and near significant) variables were considered. Unfortunately, the sample limitations and some unstandardized measurements and effects made these models challenging to define and impractical with the evidence available at this time.
References
- Hoffman JI. The global burden of congenital heart disease. Cardiovasc J Afr. 24(4): 141-5 (2013).
[CrossRef] [Google Scholar] (All versions) [PubMed]
- Qu Y, Liu X, Zhuang J, et al. Incidence of congenital heart disease: The 9-year experience of the Guangdong registry of congenital heart disease, China. PloS One. 11(7): e0159257 (2016).
[CrossRef] [Google Scholar] [PubMed]
- Thomson JDR, Aburawi EH, Watterson KG, et al. Surgical and transcatheter (Amplatzer) closure of atrial septal defects: a prospective comparison of results and cost. Heart Br Card Soc. 87(5): 466-9 (2002).
[CrossRef] [Google Scholar] [PubMed]
- Majunke N, Sievert H. ASD/PFO devices: What is in the pipeline? J Intervent Cardiol. 20(6): 517-23 (2007).
[CrossRef] [Google Scholar] [PubMed]
- O’Byrne ML, Levi DS. State of the art ASD closure devices for congenital heart. Interv Cardiol Clin. 8(1): 11-21 (2019).
[CrossRef] [Google Scholar] (All versions) [PubMed]
- Freixa X, Ibrahim R, Chan J, et al. Initial clinical experience with the GORE septal occluder for the treatment of atrial septal defects and patent foramen ovale. EuroIntervention. 9(5): 629-35 (2013).
[CrossRef] [Google Scholar] [PubMed]
- Smith B, Thomson J, Crossland D, et al. UK multicenter experience using the Gore septal occluder (GSO(TM)) for atrial septal defect closure in children and adults. Catheter Cardiovasc Interv. 83(4): 581-6 (2014).
[CrossRef] [Google Scholar] [PubMed]
- Sommer RJ, Love BA, Paolillo JA, et al. ASSURED clinical study: New GORE® CARDIOFORM ASD occluder for transcatheter closure of atrial septal defect. Catheter Cardiovasc Interv. 95(7): 1285-95 (2020).
[CrossRef] [Google Scholar] [PubMed]
- Gillespie MJ, Javois AJ, Moore P, et al. Use of the GORE® CARDIOFORM septal occluder for percutaneous closure of secundum atrial septal defects: Results of the multicenter U.S. IDE trial. Catheter Cardiovasc Interv. 95(7): 1296-304 (2020).
[CrossRef] [Google Scholar] [PubMed]
- Crawford GB, Brindis RG, Krucoff MW, et al. Percutaneous atrial septal occluder devices and cardiac erosion: A review of the literature. Catheter Cardiovasc. 80(2): 157-67 (2012).
[CrossRef] [Google Scholar] [PubMed]
- de Hemptinne Q, Horlick EM, Osten MD, et al. Initial clinical experience with the GORE® CARDIOFORM ASD occluder for transcatheter atrial septal defect closure. Catheter Cardiovasc. 90(3): 495-503 (2017).
[CrossRef] [Google Scholar] [PubMed]
- Kumar P, Orford JL, Tobis JM. Two cases of pericardial tamponade due to nitinol wire fracture of a gore septal occluder. Catheter Cardiovasc Interv. 96(1): 219-24 (2020).
[CrossRef] [Google Scholar] [PubMed]
- Zablah JE, Rodriguez SA, Leahy R, et al. Novel minimal radiation approach for percutaneous pulmonary valve implantation. Pediatr Cardiol. 42(4): 926-933 (2021).
[CrossRef] [Google Scholar] [PubMed]
- Zablah JE, Rodriguez SA, Jacobson N, et al. Rapid prototyping airway and vascular models from 3D rotational angiography: Beans to cup 3D printing. Prog Pediatr Cardiol. 63: 101350 (2021).
- Morgan GJ, Rodriguez SA, Leahy R, et al. Coronary compression testing by balloon interrogation during pulmonary valve implantation: Room for doubt? Cardiol Young. 31(9): 1419-1425 (2021)
[CrossRef] [Google Scholar] [PubMed]
- Morgan GJ, Rodriguez SA, Leahy R, et al. Abstract 12288: Three-Dimensional Location and Heatmap Distribution of Frame Fractures on the GORE Cardioform ASD Device. Circulation. 144(S1): A12288-A12288 (2021).
- Fagan T, Dreher D, Cutright W, et al. Fracture of the GORE HELEX septal occluder: Associated factors and clinical outcomes. Catheter Cardiovasc. 73(7): 941-8 (2009).
[CrossRef] [Google Scholar] [PubMed]
- Naqvi TZ, Zarbatany D, Molloy MD, et al. Intracardiac echocardiography for percutaneous mitral valve repair in a swine model. J Am Soc Echocardiogr. 19(2): 147-53 (2006).
[CrossRef] [Google Scholar] [PubMed]
- Anderson RH, Cook AC. The structure and components of the atrial chambers. Europace. 9(S6): vi3-9 (2007).
[CrossRef] [Google Scholar] [PubMed]
