Research Article - Interventional Cardiology (2017) Volume 9, Issue 1
Ventricular torsion and cardiac suction effect: The electrophysiological analysis of the cardiac band muscle
- Corresponding Author:
- Trainini Jorge
Department of Cardiac Surgery
Presidente Perón Hospital, Buenos Aires, Argentina
Tel: +541142041021
E-mail: jctrainini@hotmail.com
Submitted: 19 January 2017 Accepted: 07 February 2017 Published online: 13 February 2017
Abstract
Introduction and objectives: The Torrent Guasp concept postulates that the ventricles are formed by a continuous muscle band that begins at the level of the pulmonary valve and extends to the aortic root, limiting in this way the two ventricular chambers. This specific anatomical arrangement would support the interpretation of two fundamental aspects of left ventricular dynamics: 1) the torsion mechanism and 2) the physiology of rapid diastolic filling by the suction effect. Methods: Five patients with no structural cardiac abnormalities and normal QRS complexes underwent three-dimensional endoepicardial electroanatomic mapping during ablation of lone atrial fibrillation or concealed epicardial accessory pathways. The propagation times of the electrical activation by the muscular band was measured in milliseconds (ms). Results: 1) The apical loop is activated by a simultaneous depolarization of the distal descending and proximal ascending band segments. 2) At the point of crossing of both bands a radial activation spreads from the descending to the ascending band. From this point, begins a simultaneous and opposing activation of the proximal and distal ascending band. 3) The activation of the distal ascending band segment is the latest. Conclusions: The novel activation sequence of the Torrent Guasp band found in this study would explain the previous process triggering the ventricular torsion and suction mechanism. Moreover, this work demonstrates that activation of the ascending band segment completes the QRS. This finding explains the persistent contraction of this muscle segment during early diastole, rejecting the traditional concept of passive relaxation.
Keywords
Heart/physiology; Cardiac electrophysiology; Diastole
Introduction
Ventricular filling is generally assumed as a passive ventricular function, resulting from ventricular relaxation, elastic fiber action and circulatory “vis a tergo”. Some authors question that these mechanisms were sufficient to explain rapid left ventricular filling [1-3]. A mechanism was postulated by which at the onset of diastole (isovolumic diastolic phase) the ventricle aspirates blood actively [2-5]. The active mechanism has been expl ained by the spatial arrangement of the muscle band [1].
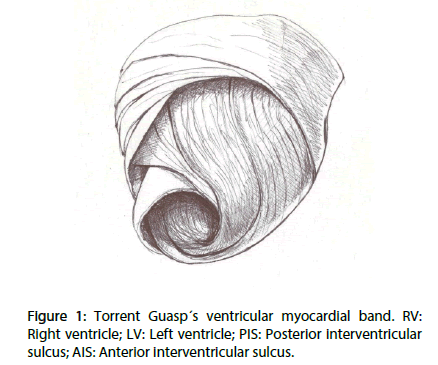
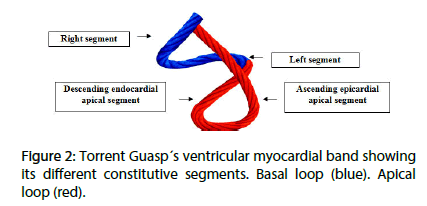
The Torrent Guasp concept postulates that the ventricles are formed by a continuous muscle band that originates at the level of the pulmonary valve and extends to the aortic root, limiting in this way the two ventricular chambers. Two muscle segments can be differentiated: the endocardial descending and the epicardial ascending band segments describing a helix with two spiral turns forming a basal loop (right and left segments) and an apical loop (descending and ascending segments). In this spatial arrangement, the descending and ascending band segments cross at a point called “crossing of band segments” (Figures 1 and 2).
This specific anatomical arrangement would support the interpretation of two fundamental aspects of left ventricular dynamics: 1) the torsion mechanism and 2) the physiology of rapid diastolic filling by the suction effect.
Although these mechanisms are currently well characterized, there are as yet no studies to clarify their electrophysiological basis in humans. The purpose of this work was to study the electrical activation sequence of the left ventricular (LV) endocardial and epicardial band segments that support this concept.
Methods
The sequence of LV endocardial and epicardial electrical activation was studied by three-dimensional electroanatomical mapping (EAM) with the Carto (Biosense Webster, California, USA) navigation and mapping system, which allows a three-dimensional representation with activation maps and electrical propagation. Isochronic and activation sequence maps were correlated with the surface ECG. Ventricular activation maps were built with 50±8 endocardial and epicardial points, providing high density detailed recordings. Apical, lateral and basal views were obtained.
The study was performed at the Hospital Presidente Perón, in Buenos Aires, Argentina. Five patients with informed consent previously approved by the Institutional Ethics Committee were included in the study. All patients had sinus rhythm, normal QRS and no structural cardiomyopathy by Doppler echocardiography and resting and exertion gamma camera studies. No nuclear magnetic resonance or coronariography studies were performed, as there was no history of cardiomyopathies or ischemic heart disease (Table 1).
| Patient | Age (years) | Gender | Study indication | Other diseases |
|---|---|---|---|---|
| 1 | 42 | F | Lone atrial fibrillation | None |
| 2 | 19 | M | Abnormal left epicardial pathway | None |
| 3 | 23 | M | Abnormal left epicardial pathway | None |
| 4 | 29 | M | Abnormal left epicardial pathway | None |
| 5 | 32 | M | Abnormal left epicardial pathway | None |
Table 1: Patients characteristics.
The EAM was performed during radiofrequency ablation of arrhythmias associated to probable abnormal epicardial pathways. Mapping was performed at the beginning of the studies, followed by routine ablation procedures. No complications were encountered. Presence of abnormal pathways did not interfere with the mapping, since baseline sinus rhythm was maintained during the whole procedure.
As the descending band segment was endocardial and the ascending one epicardial, two approaches were used to perform mapping. The endocardium was accessed by a conventional transseptal puncture and the epicardium by a percutaneous pericardial approach according to the technique described by Sosa et al. [6] Mapping of the pericardial cavity was done using an ablation catheter (Navistar® F curve. Biosense Webster, California, USA).
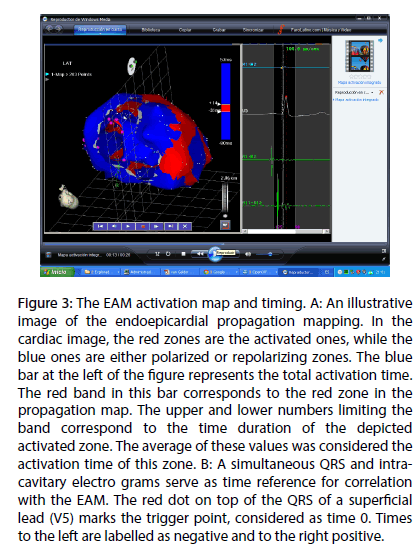
In Figure 3, panel A, an illustrative image of propagation mapping is shown. In the cardiac image, the red zones are the activated ones, while the blue ones are either polarized or repolarizing zones. The blue bar at the left of the figure represents the total activation time. The red band in this bar correspond to the red zone in the propagation map. The upper and lower numbers limiting the band correspond to the time duration of the depicted activated zone. The average of these values was considered the activation time of this zone. In Figure 3, panel B, a simultaneous QRS and intracavitary electrograms serve as time reference for correlation with the EAM. The red dot on top of the QRS of a superficial lead (V5) marks the trigger point, considered as time 0. Times to the left are labeled as negative and to the right positive.
Figure 3: The EAM activation map and timing. A: An illustrative image of the endoepicardial propagation mapping. In the cardiac image, the red zones are the activated ones, while the blue ones are either polarized or repolarizing zones. The blue bar at the left of the figure represents the total activation time. The red band in this bar corresponds to the red zone in the propagation map. The upper and lower numbers limiting the band correspond to the time duration of the depicted activated zone. The average of these values was considered the activation time of this zone. B: A simultaneous QRS and intra-cavitary electro grams serve as time reference for correlation with the EAM. The red dot on top of the QRS of a superficial lead (V5) marks the trigger point, considered as time 0. Times to the left are labelled as negative and to the right positive.
After performing the endocardial and epicardial activation maps in sequence, selected images obtained at the same activation time were selected and then electronically superimposed. This was done in right lateral and in LAO views.
Results
Isochronic mapping: Three-dimensional mapping allowed for detailed activation recordings. Although the activation sequence varied in its details, the general aspects were similar in every case, establishing an endoepicardial depolarization matrix.
As EAM corresponded to the left ventricle, the previous activation wave originating in the right ventricle was not recorded.
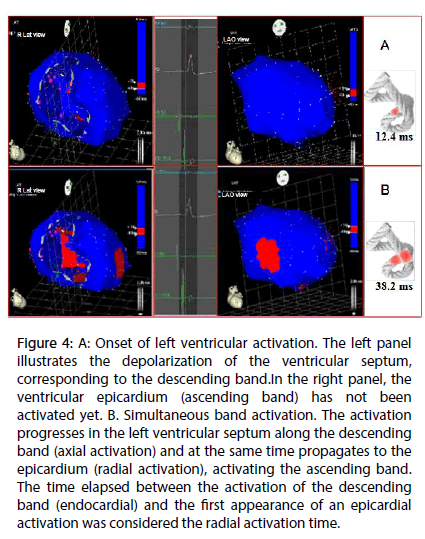
Activation sequence: The EAM imputted an average of 20 minutes per patient. No complications developed. Figures 4-6 illustrate endo and epicardial propagation of electrical activation.
Figure 4: A: Onset of left ventricular activation. The left panel illustrates the depolarization of the ventricular septum, corresponding to the descending band.In the right panel, the ventricular epicardium (ascending band) has not been activated yet. B. Simultaneous band activation. The activation progresses in the left ventricular septum along the descending band (axial activation) and at the same time propagates to the epicardium (radial activation), activating the ascending band. The time elapsed between the activation of the descending band (endocardial) and the first appearance of an epicardial activation was considered the radial activation time.
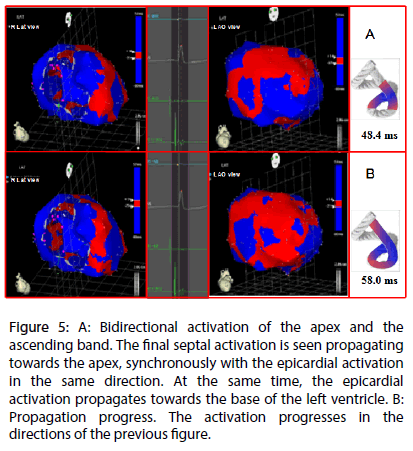
Figure 5: A: Bidirectional activation of the apex and the ascending band. The final septal activation is seen propagating towards the apex, synchronously with the epicardial activation in the same direction. At the same time, the epicardial activation propagates towards the base of the left ventricle. B: Propagation progress. The activation progresses in the directions of the previous figure.
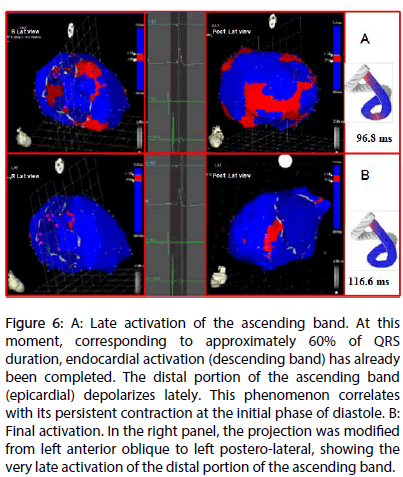
Figure 6: A: Late activation of the ascending band. At this moment, corresponding to approximately 60% of QRS duration, endocardial activation (descending band) has already been completed. The distal portion of the ascending band (epicardial) depolarizes lately. This phenomenon correlates with its persistent contraction at the initial phase of diastole. B: Final activation. In the right panel, the projection was modified from left anterior oblique to left postero-lateral, showing the very late activation of the distal portion of the ascending band.
In all figures, the left panel shows the right lateral projection and the right panel the simultaneous left anterior oblique projection. The activated areas at each moment are seen in red.
The lateral part represents the activation of the bands in Torrent Guasp’s rope model [1], where the depolarized zones are shown in red and previously activated zones in refractory period in blue. Below the rope can be seen the average propagation time of electrical muscle band measured in ms on the site analyzed (Tables 2 and 3).
| Localization | Case 1 | Case 2 | Case 3 | Case 4 | Case 5 | X | sd |
| Figure 4A | 10 | 12 | 13 | 15 | 12 | 12.4 | 1.816 |
| Figure 4B | 35 | 38 | 37 | 41 | 40 | 38.2 | 2.135 |
| Figure 5A | 45 | 47 | 49 | 52 | 49 | 48.4 | 2.332 |
| Figure 5B | 55 | 59 | 57 | 61 | 58 | 58 | 2 |
| Figure 6A | 94 | 98 | 98 | 99 | 95 | 96.8 | 1.939 |
| Figure 6B | 115 | 118 | 114 | 120 | 116 | 116.6 | 2.154 |
Table 2: Activation times (ms).
| Time | Patient 1 | Patient 2 | Patient 3 | Patient 4 | Patient 5 | X | sd |
| Time of radial propagation | 25 | 26 | 24 | 26 | 28 | 25.8 | 1.483 |
Table 3: Time of radial propagation (ms).
Left ventricular activation is initiated in the interventricular septum to 12.4±1.816 ms after the start of depolarization (Figure 4A). It then extends axially towards the ventricular apex, following the anatomical arrangement of the descending band. An epicardial area is also activated at that moment–the ascending band segment-evidencing radial activation at the point that we called the “crossing of band” (Figure 4B and Table 3). It occurs on average after 25.8±1.483 ms septal stimulation and 38.2±2.135 ms the onset of cardiac activation. This finding, as stated in the discussion section, modifies the Torrent Guasp model and constitutes the electrical basis of the mechanical phenomenon of ventricular torsion. Synchronously following the anatomical arrangement of the descendent band, activation moves axially towards the ventricular apex reaching the same on average of 58±2.0 ms (Figures 5A, 5B and Table 2). After the “crossing of band”, the activation loses its unidirectional character and becomes more complex. Figure 5A shows 3 simultaneous wavefronts: 1) The distal activation of the descending band towards the apical loop; 2) the depolarization of the ascending band from the intersection towards the apex and 3) the activation of the ascending band from the intersection towards the end of the muscle band in the aorta. Figures 5B, 6A and 6B show the progress and end of this process.
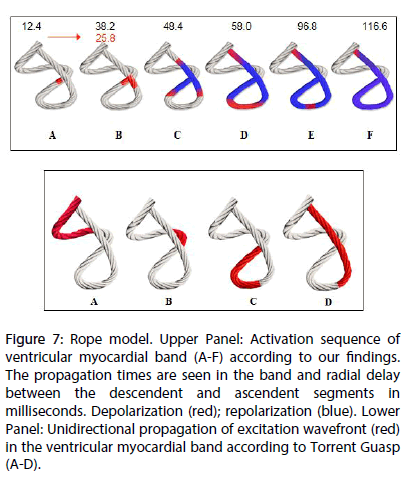
In Figure 6A it can be seen that endocardial activation finishes much earlier than the end of the QRS period; the rest of the QRS period corresponds to the late activation of the distal portion of the ascending band. This explains its persistent contraction during isovolumic diastolic phase, which is the basis of the ventricular suction mechanism (Figure 6B). Figure 7 summarizes this sequence in the rope model found in this investigation.
Figure 7: Rope model. Upper Panel: Activation sequence of ventricular myocardial band (A-F) according to our findings. The propagation times are seen in the band and radial delay between the descendent and ascendent segments in milliseconds. Depolarization (red); repolarization (blue). Lower Panel: Unidirectional propagation of excitation wavefront (red) in the ventricular myocardial band according to Torrent Guasp (A-D).
Discussion
Once the primary objective of the investigation -the activation sequence- was analyzed, it had to be correlated with two of the fundamental mechanical processes of the heart, as systolic torsion and diastolic suction. Regarding torsion, the Torrent Guasp concept of a continuous myocardial band provides an attractive alternative to the classic anatomical and functional concept. According to this theory, cardiac mechanics implies a succession of muscular movements that take place one after the other along the muscle band, producing LV stretching, shortening-torsion, lengthening-destorsion and expanding movements during the cardiac cycle [7-10]. Torrent Guasp expresses “the succession of functional events related to cardiac mechanics, represent unequivocal proof of the longitudinal diffusion of stimuli along the ventricular myocardial band” (Figure 7) [11-13].
However, this “peristaltic” sequential activation does not explain some currently well-known fundamental phenomena, such as opposing clockwise and anticlockwise LV apex and base torsion, mainly responsible for its mechanical efficiency [7-10].
Ventricular torsion is defined as the reverse rotational movement of the base and apex. This work shows a hitherto not described activation sequence that would explain ventricular torsion. At the crossing point of both band segments, activation spreads from the endocardium towards the epicardium (radial propagation), that is from the descending to the ascending band segment, and more precisely, from approximately the mid-third of the descending band segment to the mid-third of the ascending band [14]. From this point, the ascending band segment depolarizes in a dual direction; towards the apex and towards the base, at the same time as the descending band segment completes its activation towards the apex (Figure 6). Thus, two fundamental phenomena take place:
1-The apical loop depolarizes from the crossing point of both band segments with two simultaneous wavefronts (from the descending and the ascending band segments) probably generating their synchronized contraction.
2-The activation of the ascending band segment extends from the crossing point in two opposing directions: towards the apex and towards the base (Figure 6). The resulting contraction will also have a reverse sense, giving origin to clockwise and anticlockwise rotations of the apex and base. This would explain the high pressure that allows ejecting the greatest blood volume at the onset of ventricular ejection during a period that involves only 20% of this phase [15-18].
Ventricular filling is usually considered a passive function, produced by ventricular relaxation, the elastic fibers action and the “vis a tergo”. Some authors, however, question that these mechanisms are sufficient to explain rapid ventricular filling, especially of the left ventricle, during the first milliseconds after atrioventricular valve opening. An anatomo-functional mechanism has been postulated, by which during the initial phase of diastole (isovolumic diastolic phase) the ventricle actively aspirates blood. This effect would be produced by apex-base lengthening during this phase with the consequent abrupt decrease of intraventricular pressure, causing or favoring the initial rapid filling phase by a suction mechanism similar to a “plunger”, followed by diastolic relaxation of the ventricular wall and slow filling. The rationale for this mechanism would be the persistent contraction of the ascending band segment during the initial phase of diastole, called the isovolumic diastolic phase. Although Torrent Guasp presents convincing anatomical evidence, his works lack functional studies to similarly evaluate his concept [19-23].
The activation of the ascending band segment occurs after depolarization of the descending band segment, a delay that is due to the propagation of activation from the endocardium to the epicardium.
We have shown in this study that the endocardium depolarizes completely during the first part of the QRS. In turn, Buckberg et al. [13] found that the mechanical contraction triggered by this electrical phenomenon starts 50 ms later and persists for approximately 350 ms. If the depolarization of the ascending band segment starts 25-50 ms in our investigation after that of the descending one and its contraction persists for the same period of time, the ventricular contractile state will last approximately 400 ms. If ventricular systole lasts around 300 ms, the remaining 100 ms correspond to the isovolumic diastolic phase (sometimes called isovolumic relaxation). Briefly, during the initial part of diastole, the ascending band segment would remain contracted due to the depolarization occurring during the course of the QRS. Thus, the explanation of this delayed contraction does not require depolarizations after the QRS [24].
In the present study, the final part of the QRS corresponds to the activation of the ascending band (Figure 6B), which would enable its persistent contraction during the isovolumic diastolic phase, generating a suction mechanism through the “plunger effect”. With the initiation of untwisting during isovolumic diastole, the ascending band progressively lengthens, generating a negative intraventricular pressure while it is still contracted (active process), as an energetic residue of the twisting process [25].
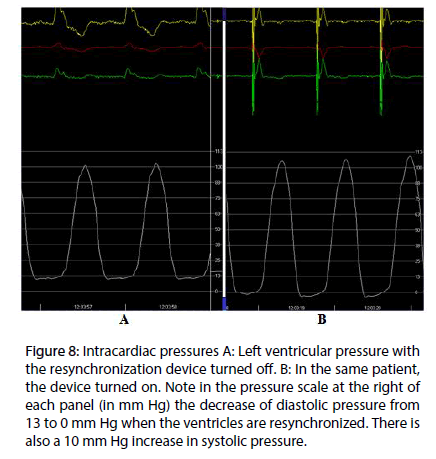
At present, we are measuring the intracavitary pressure in the left ventricle in patients under endocardial cardiac resynchronization therapy, in order to get the evidence of the suction mechanism in the diastolic isovolumetric phase. The hypothesis is that in left bundle branch block the sequence of electrical activation–and in consequence the mechanical sequence–are altered, thus impairing the suction mechanism. Endocardial left ventricular stimulation at the site of band intersection results in restoration of both electrical and mechanical activity, normalizing the suction mechanism. In Figure 8A is shown the pressure curve in patient with left bundle block. With resinchronization (Figure 8B), there is a drop in diastolic pressure, due to the suction mechanism. This decreases the pulmonary diastolic pressure, improving the heart failure symptoms.
Figure 8: Intracardiac pressures A: Left ventricular pressure with the resynchronization device turned off. B: In the same patient, the device turned on. Note in the pressure scale at the right of each panel (in mm Hg) the decrease of diastolic pressure from 13 to 0 mm Hg when the ventricles are resynchronized. There is also a 10 mm Hg increase in systolic pressure.
Conclusion
According to these results, we may infer:
1. Endo-epicardial three-dimensional mapping shows an electrical activation sequence in the area of the apex loop in agreement with the synchronic contraction of the descending and ascending band segments.
2. The simultaneous and opposing activation of the ascending band segment to the starting point of its radial activation from the descending band segment is consistent with the simultaneous reverse rotation of the apical and basal areas (ventricular torsion mechanism).
3. Late activation of the ascending band segment, compatible with its persistent contraction during the initial phase of isovolumic diastole, takes place without need of postulating electrical activations after the QRS.
The novel activation sequence of the Torrent Guasp muscle band found in the present work, would explain the previous process triggering ventricular torsion and the suction mechanism. Moreover, it establishes that the activation of the ascending band segment completes the QRS. This finding explains the persistent contraction of this muscle segment during the first part of diastole, ruling out the traditional concept of passive relaxation.
With respect to clinical implications, the study postulates a “three-phase heart”: systole, suction and diastole. We consider that the data obtained are particularly important as they were recorded in humans, with structurally normal hearts and in physiological conditions (not experimental). It remains to be seen what happens in different pathologies.
During the course of the last years, the pathology of ventricular filling and diastolic failure has become important. In this regard, a great number of studies have focused on the altered passive properties of the myocardium.
It is possible however, that at least some of these pathologies are due to ventricular contractile dysfunction during diastole. Similarly, systolic alterations could be attributed in some cases, to changes in the apical loop activation. The corroboration of this phenomenon could have clinical and therapeutic consequences. It would be possible to develop heart failure classifications based on the suction phase, as well as pharmacological or surgical therapies or treatments with any device that consider the regulation of the persistent diastolic contraction of the ascending band segment, the temporization and/or synchronization of contraction of both band segments, etc. Actually, the pathophysiological basis of cardiac resynchronization therapy could correspond to this phenomenon. We have also rescued the value of the apex in the resolution of ventricular reduction techniques as well as anatomical speculations of the great band on the different functions of the basal and apical loops, the first one more involved with the ejection phase and the second one with the filling and suction phase. The path remains open, especially since we know that a dilated heart does not have an adequate suction phase and hence an efficient contraction. The active mechanism of the great myocardial band on diastolic effect opens a wide field for surgical repair techniques, both of the shape and volume, and hence the function of the left ventricle.
Limitation of the Study
The small number of patients precludes defining an adequate statistically grounded theory.
References
- Torrent GF. Estructura y mecánica del corazón. Grass Ed. Barcelona. pp 35-84 (1987).
- Brecher GA. Cardiac variations in venous return Studies with new Bristle flowmeter. Am. J. Physiol.176, 423-430 (1954).
- Brecher GA. Experimental evidence of ventricular diastolic function. Circ. Res. 4, 513-518 (1956).
- Trainini JC, Herreros J, Cabo J, et al. La bomba de succión cardiaca. Aplicación de la banda miocárdica de Torrent Guasp al tratamiento quirúrgico de la insuficiencia cardiaca. Cir. Cardiovasc. 18, 103-112 (2011).
- Cosín-Aguilar J, Hernándiz Martínez A, et al. Estudio experimental de la llamada fase de relajación isovolumétrica del ventrículo izquierdo. Rev. Esp. Cardiol. 62, 392-399 (2009).
- Sosa E, Scanavacca M, d’Avila A, et al. A new technique to perform epicardial mapping in the electrophysiology laboratory. J. Cardiovasc. Electrophysiol. 7, 531–536 (1996).
- Lewis T, Rothschild MA. The excitatory process in dog´s heart. II- The ventricles. Philos. Trans. R. Soc. 206, 1981-1989 (1915).
- Robb JS, Robb RC. The excitatory process in the mamalian ventricle. Am. J. Physiol. 115, 43-52 (1936).
- Robb JS, Robb RC. The normal heart: Anatomy and physiology of the structural units. Am. Heart. J. 23, 455-467 (1942).
- Armour JA, Randall WC, Structural basis for cardiac function. Am. J. Physiol. 218, 1517-1523 (1970).
- Torrent GF. La estructuración macroscópica del miocardio ventricular. Rev. Esp. Cardiol. 33, 265-287 (1980).
- Torrent GF. Estructura y función del corazón. Rev. Esp. Cardiol. 51, 91-102 (1998).
- Buckberg GD, Coghlan HC, Torrent GF. The structure and function of the helical heart and its buttress wrapping. V. Anatomic and physiologic considerations in the healthy and failing heart. Semin. Thorac. Cardiovasc. Surg. 132, 358-385 (2001).
- Torrent GF, Buckberg G, Carmine C, et al. The structure and function of the helical heart and its buttress wrapping. I. The normal macroscopic structure of the heart. Sem. Thorac. Cardiovasc. Surg. 13, 301-319 (2001).
- Poveda F, Gil D, Martí E, et al. Estudio tractográfico de la anatomía helicoidal del miocardio ventricular mediante resonancia magnética por tensor de difusión. Rev. Esp. Cardiol. 66, 782-790 (2013).
- Cosín-Aguilar J, Hernándiz Martínez A. La disposición de las fibras miocárdicas en una banda condiciona la morfología y la función del corazón. Rev. Esp. Cardiol. 66, 768-770 (2013).
- Trainini JC, Andreu E. Tiene significado clínico la remodelación reversa quirúrgica del ventrículo izquierdo. Rev. Argent. Cardiol. 73, 44-51 (2005).
- Sallin EA. Fiber orientation and ejection fraction in the human ventricle. Biophys. J. 9, 954-964 (1969).
- Li P, Wang Z, Ballester M, et al. Isolated diastolic dysfunction is a contraction abnormality: new insights from left ventricular longitudinal and torsional dynamics by velocity vector imaging. Circulation.112, I5 (2005).
- Sengupta PP, Khandheria BK, Kornek J, et al. Apex-to-base dispersion in regional timing of left ventricular shortening and lengthening. J. Am. Coll. Cardiol. 47, 163-172 (2006).
- Carreras F, Ballester M, Pujadas S, et al. Morphological and functional evidences of the helical heart from non-invasive cardiac imaging. Eur. J. Cardiothoracic. Surg. 29(1), S50-55 (2006).
- Wu MT, Tseng WYI, Su MYM, et al. Diffusion tensor magnetic resonance imaging mapping the fiber architecture remodeling in human myocardium after infarction. Correlation with viability and wall motion. Circulation.114, 1036-1045 (2006).
- Ashikaga H, Coppola BA, Hopenfeld B, et al. Transmural dispersion of myofiber mechanics. J. Am. Coll. Cardiol. 49, 909-916 (2007).
- Zarco P. The ventricular rapid filling phase: a muscle relaxation or contraction process? Rev. Esp. Cardiol. 54, 1031-1032 (2001).
- Sonnenblick EH. The structural basis and importance of restoring forces and elastic recoil for the filling of the heart. Eur. Heart. J. 1, 107-110 (1980).
