Research Article - Clinical Practice (2017) Volume 14, Issue 5
Morphological factors influence on young women arterial pressure levels
- Corresponding Author:
- Olena Lutsenko
Hlukhiv Oleksandr Dovzhenko National Pedagogical University, Ukraine
E-mail: olena85lutsenko@gmail.com
Abstract
Many studies point to the correlation between the physical development indexes and functioning of the cardiovascular system. At the same time, the problem of the correlation between the morphological parameters of arterial pressure in the group of healthy young women is not studied enough.
Keywords
arterial pressure, ovarian-menstrual cycle, typology, muscle component
Introduction
A human being as a biological specie has a high level of the morphological and functional variability [1-5,9]. A number of works were devoted to researching the age and sex regularities [1,17,18].
In the process of the body growth and development the cardiovascular system abilities are significantly altered, the correlation between the central and autonomic regulation of the cardiac rhythm is optimized, complex mechanisms of cardiac control are improved [6-11,20].
Many studies indicate existing of the correlation between the physical development and the functioning indices of the cardiovascular system (CVS) – heart rate (HR), systolic (SAP) and diastolic (DAP) arterial pressure [12,13].
Thus in some works [14,19] the presence of the reliable positive correlation between the physical development parameters and arterial pressure is shown. There are also data on revealing these values of the sympathy-parasympathetic balance (LF/HF) of obese subjects compared to the control group with the BMI (body mass index) within the physiological norm [14]. At the same time, the nature of these correlations and health assessment prospects are debatable. The problem of the correlation between morphological parameters and arterial pressure of healthy young women is practically not researched and the nature of this correlation is almost not defined.
Methods
The study was conducted in compliance with the basic bioethical provisions of the Council of Europe Convention on Human Rights and Biomedicine (of April 4. 1997), Helsinki declaration of the World medical association on ethical principles of conducting scientific medical investigations with participation of humans (1994-2008), and the Order of the Ministry of Health Protection of Ukraine № 690 of September 23. 2009.
Measuring was carried out on 77 women aged 18- 19 years in conditions close to the state of the basic metabolism in the prone position at rest, during tilt test and during the psycho - emotional loading using Makarenko’s method [13]. Every tested woman was investigated three times: during the follicular phase (I), ovulation (II) and luteal phase (III) of ovarian-menstrual cycle (OMC). Defining the phases of the cycle was carried out according to the anamnesis, basal temperature measurement and applying the set of ovulation jet tests «Solo» (IND Diagnostic. Inc. Canada).
Analytical methods
Systolic (АPs) and diastolic (АPd) arterial pressure was measured by the Korotkov’s method by a mercury tonometer (Riester. Germany). Mean arterial pressure (APm) was calculated with Hickam formula.
Anthropometric indices were measured by the method of Bunak [4] taking into account the methodical recommendations of Martirosov [14]. The research protocol included measuring the following parameters: body weight, body height, chest girth, thickness of 7 skin fat folds. Standard tools were used for measuring relevant anthropometric indicators. The thickness of skin fat folds was measured by a caliper with a constant pressure of 10 g/mm2 under the shoulder blade, over the triceps, biceps, on the abdomen, chest, forearm, thigh and shin. The body mass was separated for fat, muscle and bone components according to the formulas [4]. Weight and height correlation was assessed by way of applying the body mass index (BMI or Kettle index) which was calculated with the following formula: BMI=Mass (kg)/height (m2), which norm is 18.5-24.9 kg/m2 according to the World Health Organization classification. Rorer Index (RI or body density index kg/m3) was calculated with the following formula: RI=Weight (kg)/Height (m3), which norm is 1.16-1.30 kg/m3. For calculating body area as one of the important physical development indices Isakov formula was applied [19].
Statistical methods
All the results of the anthropometric study were calculated by the methods of variational statistics. Commonly accepted indicators were calculated: arithmetic mean (M), mean square deviation (SD). The reliability of differences between values in different OMC phases was estimated by means of Wilcoxon Paired Comparison and Student’s t-test. The relationship between indicators was calculated by the nonparametric Spearman correlation coefficient (Glantz 2012).
Results and discussion
It is generally accepted that arterial pressure is an important homeostatic index of the body. In the prone position the indices of АPs. АPd and АPm were respectively 99.93 ± 0.62 mm of mercury, 64.43 ± 0.43 mm of mercury and 76.13 ± 0.40 mm of mercury. During the tilt test these indices credibly increased (р<0.001). Credible increasing of AP compared to levels in prone position at rest (р<0.001) was also observed during the psycho emotional loading [10-12,18].
One of the factors causing such variability of both levels and reactivity of AP of women in different phases of the ovarian-menstrual cycle and under different conditions is their morphological indices. To find out the influence of morphological parameters on AP levels the factor analysis was carried out which results made it possible to allocate three factors with their own values exceeding 1 (TABLE 1).
| Indices | Factor 1 | Factor 2 | Factor 3 |
|---|---|---|---|
| Chest girth | 0.78 | 0.08 | 0.00 |
| Body heihgt | 0.01 | -0.04 | -0.99 |
| Body weight | 0.97 | 0.11 | -0.05 |
| Fat component | 0.68 | 0.73 | -0.01 |
| Muscle component | 0.93 | 0.09 | -0.08 |
| Bone component | 0.53 | 0.83 | 0.00 |
| Body area | 0.95 | 0.08 | -0.06 |
| Kettle index | 0.95 | 0.16 | 0.06 |
| Rorer index | 0.83 | 0.17 | 0.12 |
| Relative weight of fat component | 0.23 | 0.96 | 0.01 |
| Relative weight of muscle component | -0.96 | -0.03 | -0.04 |
| Relative weight of bone component | -0.12 | 0.98 | 0.04 |
| Proper indices of factors | 6.63 | 3.20 | 1.01 |
| Part of general variability | 0.55 | 0.27 | 0.08 |
Таble 1. Results of the factor analyses of women’s morphometric indices (18-19 years) by the method of the main components with rotating Biquartimax.
The first factor was mostly determined by the chest girth, body weight, fat component, muscle component, body area. Rorer and Kettle indices, relative weight of the muscle component (factor of loading were 0.78, 0.97, 0.68, 0.93, 0.95, 0.95, 0.83, -0.96 respectively).
The second factor was determined by the fat component, bone component, relative weight of the fat and bone components (factor loads – 0.73, 0.83, 0.96, and 0.98 respectively).
The third factor was determined by the body height. Its factor load was– 0.99.
Thus, the peculiarities of AP in women group with different levels of relative weight of the muscular component were analyzed.
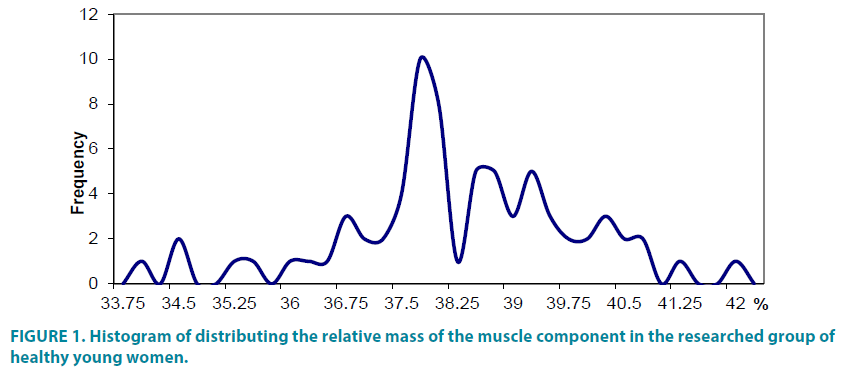
The histogram analyses of distributing the relative mass of the muscle component in the group of healthy young women (FIGURE 1) showed that there exist several typological groups in the researched sample. That is why three groups were distinguished: with low component – less than 37.25%, middle – from 37.25% tо 38.25% and high – over 38.25%.
TABLE 2 represents the indices of the arterial pressure levels under different conditions for women with different muscle component values. So, in the prone position at rest we marked a significant decrease of АPm in extreme groups, namely ˂37.25% and ˃38.25%. While changing the position for standing changes occurred in group ˃38.25% by the values of АPs and АPm. Under conditions of the psycho - emotional loading changes in the extreme groups were also observed. Close interconnection between the component and pressure is confirmed by the researches of the other authors [5,7,8,15,16].
| Мuscle component. % | АPsyst. mm of mercury |
АPdiast. mm of mercury |
АPmean. mm of mercury |
|---|---|---|---|
| Prone position at rest | |||
| less than 37.25% | 100.33±1.16 | 65.11±0.96 | 76.90±0.91* |
| 37.25-38.25% | 98.83±1.03 | 63.58±0.78 | 74.98±0.60 |
| over 38.25% | 100.89±1.06 | 64.89±0.64 | 76.85±0.67* |
| Tilt test | |||
| less than 37.25% | 105.78±1.46 | 67.11±0.83 | 80.00±0.84 |
| 37.25-38.25% | 103.33±1.11 | 66.60±0.57 | 78.85±0.66 |
| over 38.25% | 105.67±1.05* | 67.41±0.62 | 80.16±0.61* |
| Psycho-emotional loading | |||
| less than 37.25% | 101.79±1.42 | 65.60±0.69 | 77.66±0.82* |
| 37.25-38.25% | 99.74±0.87 | 64.62±0.49 | 76.32±0.51 |
| over 38.25% | 102.83±1.02* | 65.83±0.61 | 78.17±0.61* |
Таble 2. Arterial pressure levels of women with different muscle component.
Defined by us and the other authors connection between the morphometric and hemodynamic indices allows us to assume that individuals with the extreme types of the muscular component values can demonstrate tension in regulating the cardiovascular system.
Reactivity of the arterial pressure indices at the tilt test was the same for people with different levels of muscle component. Concerning the psycho-emotional loading women with higher level of muscle component (over 38.25%) have less changes of the arterial pressure compared with women with the average muscle component indices. So, herewith the reactivity indices were the following: АPs-4.20 mm of mercury; АPd - -4.15 mm of mercury; АPm - -4.72 mm of mercury with the muscle component of 37.25- 38.25% and АPs - -3.58 mm of mercury; АPd - -2.31 mm of mercury and АPm - -3.02 mm of mercury with the component level over 38.25%.
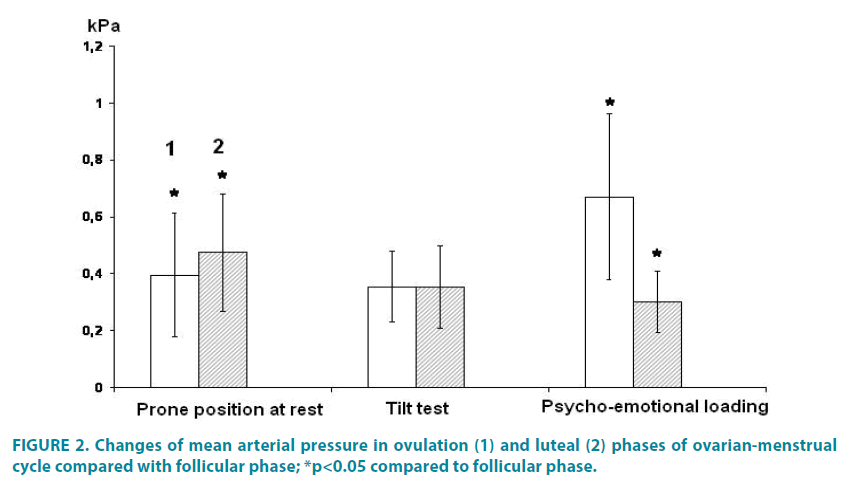
The AP levels and their reactivity can be influenced by the functional altering the female body in the different of the ovarian-menstrual cycle phases FIGURE 2.
In the prone position at rest АPs credibly increased in phases ІІ and ІІІ compared with phase І: difference between phase І and ІІ was 0.39 ± 0.21 кPа (p<0.05), while difference between phases І and ІІІ was - 0.47 ± 0.20 кPа (р<0.05). During the tilt test increasing the АPs was observed in phase І and ІІ, while in phase ІІІ the changes were not statistically significant. Herewith the difference of АPs in phase І-ІІ was - 0.35 ± 0.12 кPа and in phases І-ІІІ it was 0.35 ± 0.14 кPа.
It is obvious that increasing the arterial pressure is due to reducing the length of the peripheral vessels, and the result of it is increasing the pressure in the vessels of the lower limbs [12,15]. The mechanism of compensatory reacting the tilt test is due to changes in the activity of baroreceptors in response to changes in the arterial pressure, inhibiting the vagal influence and increasing the sympathetic influence on the heart and blood vessels [17-20]. With the psycho emotional loading the level of АPs in phase ІІІ compared to that in phase І was leveled (р<0.05). Herewith the difference index of АPs made: 0.67 ± 0.20 кPа (р>0.05) and 0.30 ± 0.10 кPа respectively.
So, the arterial pressure reacting on such a load is characterized by certain peculiarities and there is an increase in the level of the arterial pressure in the ovulation and even more in the luteal phase of the ovarian-menstrual cycle compared to the follicular phase [6].
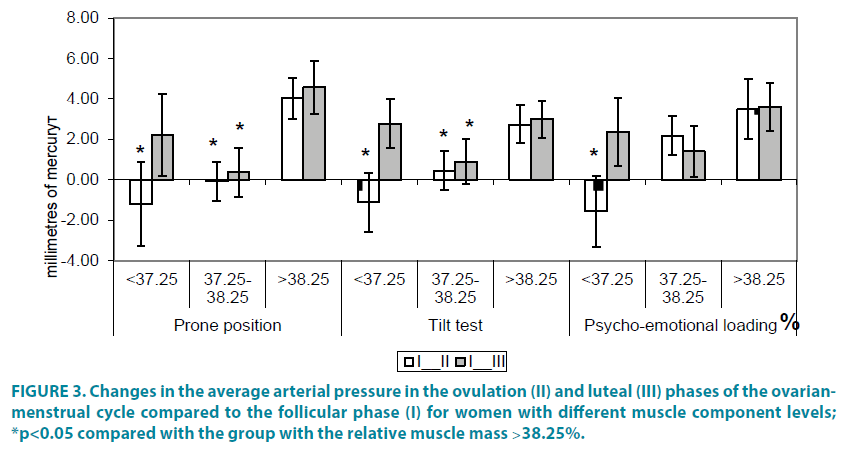
For women with different levels of muscle component the peculiarities of the arterial pressure in different phases of the ovarianmenstrual cycle and in different conditions were identified FIGURE 3.
In the prone position at rest the arterial pressure credibly increased in phase ІІ with the muscle component level ˂37.25% and its index was – 1.20 mm of mercury (р<0.05). With the component level of 37.25-38.25% the valid changes in the average arterial pressure were observed both in phase ІІ and ІІІ and their indexes were respectively: -0.07 mm of mercury and 0.37 mm of mercury (р<0.05). On condition of increasing the muscle component level ˃38.25% the valid changes of the average arterial pressure were not observed in any phase.
During the tilt test the following situation was observed: with the component level ˂37.25% the average arterial pressure index was -1.11 mm of mercury (р<0.05). With the component level 37.25-38.25% the valid changes of the average arterial pressure were observed both in the ІІ and ІІІ phases and their indexes were 0.457 mm of mercury and 0.90 mm of mercury respectively (р<0.05). On condition of increasing the muscle component level ˃38.25% the valid changes of the average arterial pressure were not observed.
During the psycho - emotional loading the average arterial pressure level changed only in phase ІІ with the muscle component level ˂37.25% compared with phase І while its index was -1.55. Consequently, the arterial pressure reacting to such a load is characterized by certain peculiarities and all of them are characterized by changes in the arterial pressure in the ovulation and even more in the luteal phase of the ovarianmenstrual cycle compared with the follicular one.
It is obvious that the increase in the arterial pressure is due to reducing the length of the peripheral vessels leading to increased pressure in the vessels of the lower limbs [2,11]. The mechanism of the compensatory reaction to tilt test is due to changes in the activity of baroreceptors responding to changes in the arterial pressure. Inhibiting the vagal and increasing the sympathetic influence on the heart and blood vessels [3,12]. Similar adaptive changes are of the compensatory nature and are likely to contribute to the increased pressure during the tilt test.
Conclusions
1. It was concluded that in the state of rest and during the psycho-emotional loading women had changes in the levels of the arterial pressure average in phases II and III of the ovarian cycle compared to phase I.
2. Analysis of the histogram of distributing the relative muscle component weight of healthy young women allowed distinguishing several typological groups in the researched sample.
3. Changes in the average arterial pressure in phases II and III of the ovarian-menstrual cycle were detected in comparison with phase I for women with different levels of muscle component in the prone position at rest and during the tilt test.
References
- Antelmi I, Paula R, Shinzato AR, et al. Influence of age, gender, body mass index.,and functional capacity on heart rate variability in a cohort of subjects without heart disease. Am. J. Cardiol. 3 (93), 381-385 (2004).
- Bernardi L, Leuzzi S, Radaelli A, Johnston J. Low-frequency spontaneous fluctuations of R-R interval and blood pressure in conscious humans: a baroreceptor or central phenomenon. Clin. Sci. 87(6), 649-654 (1994).
- Brunt Ve, Miner JA, Kaplan PF, et al. Short-term administration of progesterone and estradiol independently alter carotid-vasomotor, but not carotid-cardiac, baroreflex function in young women. Am. J. Physiol. Heart Circ. Physiol. 305, 1041-1049 (2013).
- Bunak VV. Anthropometry. Moscow. GIPN of the RSFSR 364 p [Russian] (1941).
- Capuano V, Bambacaro A, Arminio TD, et al. Correlation between body mass index and others risk factors for cardiovascular disease in women compared with men. Monaldi Arch. Chest. Dis. 4 (60), 295-300 (2003).
- Dimitriyev DA, Sapyerova YV, Dimitriyev AD, Karpenko YD. Features of the functioning of the cardiovascular system in different phases of the menstrual cycle: the Russian Journal of Physiology. THEM. Sechenova. 93(3), 300-305 [Russian] (2007).
- Furman YM, Vasylenko DA, Ocheretna OL. Osoblyvosti korelyatsiynykh zvyazkiv pokaznykiv variabel’nosti sertsevoho rytmu z antropometrychnymy pokaznykamy u pidlitkiv riznykh somatypiv. Visnyk Morfolohiyi. 14 (1), 42-46 [Ukrainian] (2008).
- Jackson AS, Pollock ML, Ward A. Generalized equations for redicting body density of women. Med. Sci. Sports Exerc. 12, 175-182 (1980).
- Kontosić I, Mesaros-Kanjski E, Bozin-Juracić J, et al. Some anthropometric characteristics, reactions on physical stress, and blood pressure in males aged 18 in «Primorsko-Goranska» County. Croatia. Coll. Antropol. 1 (25), 31-39 (2001).
- Kovalenko SO, Kudij LI, Lutsenko OI. Peculiarities of male and female heart rate variability. Sci. Edu. New Dimension. 1(2), 17-20 (2013).
- Kovalenko SO, Lutsenko OI. Osoblyvosti tsentral’noyi hemodynamiky ta yiyi khylyovoyi struktury u zhinok v stani spokoyu ta pry ortoprobi v rizni fazy ovarial’no-menstrual’noho tsyklu. Visnyk problem biolohiyi i medytsyny: № 1 (98), 278-281 [Ukrainian] (2013).
- Lutsenko OI, Kovalenko SO. Blood Pressure and Hemodynamics: Mayer Waves in Different Phases of Ovarian and Menstrual Cycle in Women. Physiol. Res. 66, 235-240 (2017).
- Makarenko MV. A method for performing a study and assessment of the individual neurodynamic properties of human higher nervous activity. Fiziol Zh. 45, 125-131 [Ukrainian] (1999).
- Martirosov EG, Nikolayev DV, Rudnyev OG. Nonnology and methods for determining the composition of the human body. Moscow: Nauka Publishers. 248p [Russian] (2006).
- Mohrman DE, Heller LJ. Cardiovascular Physiology. Mcgraw-Hill: Lange Medical Books. 257 p (2002).
- Muscelli E, Emdin M, Natali A, et al. Autonomic and hemodynamic responses to insulin in lean and obese humans. J. Clin. Endocrinol. Metab. 6 (83), 2084-2090 (1998).
- Nikolayev VG, Nikolayeva NN, Sindeyeva LV, Nikolayeva LV. Anthropological examination in clinical practice. Krasnoyarsk: Publishing house «Verso» 173 p [Russian] (2007).
- Princi T, Parco S, Accardo A, Radillo O: Parametric evaluation of heart rate variability during the menstrual cycle in young women. Biomed. Sci. Instrum. 41, 340-345 (2005).
- Prokashko IY. Individual-year dynamics of physiological functions in females. For the degree of candidate of medical sciences. 27 [Russian] (2005).
- Ravisankar P, Udupa K, Prakash E. Correlation between body mass index and blood pressure indices. Handgrip strength and handgrip endurance in underweight. Normal weight and overweight adolescents. Indian J. Physiol. Pharmacol. 4 (49), 455-461 (2005).
