Research Article - Neuropsychiatry (2017) Volume 7, Issue 4
Effects of Container Elongation on Consumers Volume Perception
- *Corresponding Author:
- Dr. Yi-Lang Chen
Professor
Department of Industrial Engineering and Management
Ming Chi University of Technology
84, Gungjuan Rd., Taishan Dist.,
New Taipei 24301, Taiwan
Tel: +886-2-29089899#3103
Fax: +886-2-29085900
Abstract
The present study examined the effects of cup elongation (short, wide vs. tall, slender) on consumers’ volume perception. Ninety participants were recruited in the study and were required to pour juice into a given container to referenced volumes (150 mL for tumbler and 100 mL for goblet) using their own judgment. Results showed that the short, wide tumbler resulted in less volume poured (134.5 ± 26.1 mL) than did the tall, slender tumbler (146.6 ± 26.3 mL) when the volume of the referenced tumbler was set at 150 mL. Similar results were also found for the goblet. The contrasting results for the tumbler, between the present study and previous study, may be attributed to different viewing positions; thus, the different optical cues dominated the judgment. The findings imply that the container volume perceptions were not only influenced by the elongation variable but also by viewing position.
Keywords
Optical illusion; Elongation; Volume perception; Container; Viewing position
Introduction
The adage “Seeing is believing” is not necessarily correct in some cases. Optical illusions are a typical example. Optical illusions are often described as visual images that differ from reality: The eyes and brain “see” something that does not quite match the physical measurement of the image. Recently, many investigators have begun applying human optical illusions to real-word settings; for example, Raghubir and Krishna [1] recommended the use of certain dish types for dieters, Wansink and van Ittersum [2] investigated the influence of such illusions on consumer behavior, and Wansink and van Ittersum [3] suggested that a household tablespoon should not be used to provide a child medicine from a container.
In 1996, Wansink [4] first investigated the effect of package size on customers’ purchases, finding evidence that an effect exists. Subsequently, a series of studies have been conducted by Wansink and van Ittersum [2,5]. The results of the studies confirmed that people overestimate the volume of a tumbler with a tall, slender shape. They have also determined that obese children in a weight-loss center would increase their juice intake by an average of 88% when a short, wide tumbler was used, when compared with a tall, slender tumbler. A similar phenomenon was also observed in adults in the center. Moreover, experienced bartenders made judgment errors of up to 26% when perceiving volume. A study on cup elongation by the psychologist Piaget [6] revealed that children tended to determine the volume of a cup by the height of the liquid, ignoring the diameter of the cup. Raghubir and Krishna [1] compared short, wide and tall, slender tumblers and obtained similar results. The differences in volume perception between the cup elongations has been attributed to an optical horizontal–vertical illusion [7,8]. The visual horizontal–vertical illusion refers to the tendency to overestimate vertical distances relative to horizontals in both 2-D and 3-D presentations [9].
In addition to cup elongation, Wansink, Painter, and North [10] compared both normal and self-service (bottomless) bowls. They found that normal bowls had visual cues that limited the intake of soup, whereas the use of self-service bowls, which had no visual cues, led to unintentional overeating. Remarkably, despite consuming a 73% more soup on average, participants did not believe that they had consumed more, nor did they perceive themselves as having consumed more than those eating from normal bowls. In other words, a person’s judgment of consumption may tend to be based on the amount of food they see (even if this is an illusion), rather than how much they really eat. This implies that visual cues of the containers may dominate the volume perceptions.
In Taiwan, Lan [11] extended the study of Wansink and van Ittersum [5] and examined whether the illusion effect still exists when opaque cups are used. The results showed that when no liquid height was available for reference, participants had to refer to the cross-sectional shape of the cup, resulting in contradictory results to those of Wansink and van Ittersum [5]. That is, the opaque tall, slender tumblers caused significantly less liquid to be poured than the short, wide containers did. Recently, Szocs and Lefebvre [12] investigated the effect of viewing angle on consumers’ portion size perceptions and consumption and found that when participants had a downward viewing angle they perceived the portion as larger when it was presented horizontally. They concluded that, when individuals view a plate of food at a downward angle (e.g., when seated at a dining table) the surface area is easier to encode than the height dimension and therefore is used as a heuristic for size. Their finding may partially explain the contradictory result between that of Lan [11] and the previous studies. However, only surface area perceptions of a plate of foods (neither tumbler nor goblet) were examined by Szocs and Lefebvre [12]. The present study therefore attempted to extend the previous studies and examine the effects of tumbler and goblet elongation (short, wide vs. tall, slender) on consumers’ volume perception. Both container types are most commonly used by people for the daily drinking. Unlike the tumbler has been extensively investigated, the effect of goblet elongation on consumers’ volume perception remains unknown.
Methods
▪ Participants
Ninety participants (48 women and 42 men) participated in an experiment involving pouring juice. All participants were aged between 18 and 25 years, with a mean (SD) age of 21.3 (2.6) years. The participants were equally distributed, with one-third being students majoring in engineering (N=30), design (N=30), and management (N=30). No participant exhibited visual defects such as color blindness or color weakness. The inclusion criteria were no vision defect with the naked eye or after vision correction.
▪ Experimental containers
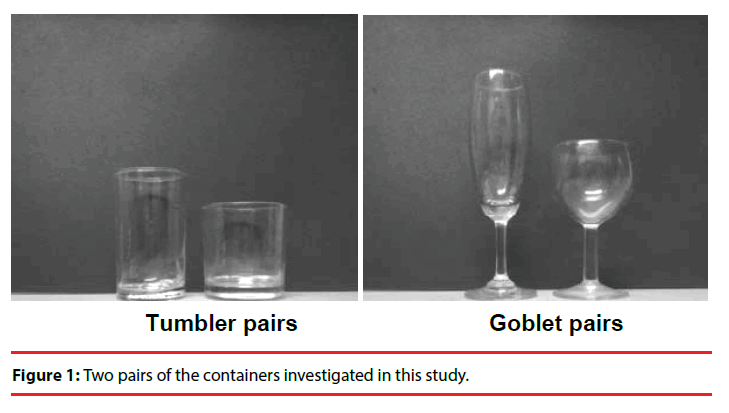
The containers used in this study were purchased from Taiwanese supermarkets and were types and sizes that people are most familiar with (Figure 1), thus preventing unfamiliarity from interfering with any visual illusion. The cup elongation (ratio of the diameter to height) was 1.0 for the short, wide tumbler and goblet, whereas the elongation was 0.5 and 0.4 for the tall, slender tumbler and goblet, respectively. The maximum volume of each container type was equal and approximately 200 mL for the tumbler and 150 mL for the goblet.
▪ Experimental design
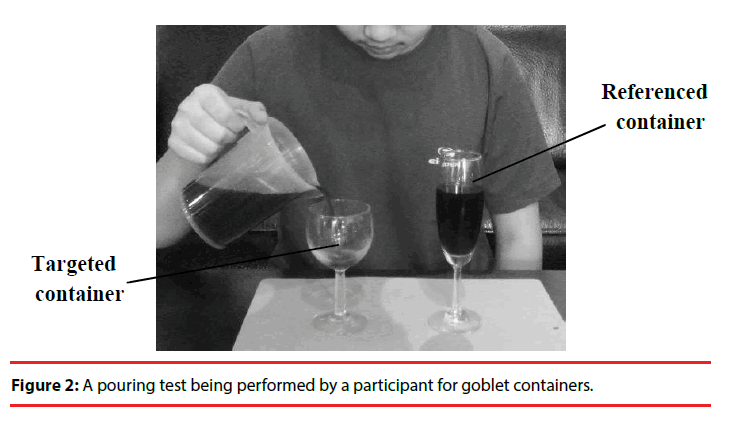
In the study, the participants were requested to perform the tests that involved pouring juice into one of two paired containers. The paired containers included tumblers and goblets, as shown in Figure 1. The goblet test is exemplified as follows (Figure 2): If the participants were first asked to refer to the prefilled “referenced” goblet (tall, slender) and then pour the identical amount of juice into the “targeted” goblet (short, wide), the reverse procedure was performed in the repeat trial. Specifically, the referenced and targeted goblets were switched. Subsequently, a total of 360 data items were collected (90 participants × 2 container pairs (tumbler pairs and goblet pairs) × 2 repetition). For each test combination, the referenced container and targeted containers were arranged in a random order and repeated among the participants, thus controlling for any possible order bias and visual fatigue.
▪ Procedures
To simulate a real-life consumer viewing position to the container, participants were requested to adopt a natural seated posture. A pair of containers was set at a distance of approximately 20 cm from the edge of the table, and the distance between the containers was set at 15 cm, as shown in Figure 2. When the experiment began, the participant was asked to pour the juice into the targeted container by referring to the referenced container. The volumes of referenced containers were set at 100 and 150 mL for the goblet and the tumbler, respectively. However, the referenced volumes for the containers were hidden from the participants. Each participant slowly poured the juice into the targeted container until he or she felt that the volume was identical to that of the referenced container. However, the participants were provided with a straw to remove the juice, if they felt that the juice was over poured. Once the trial had finished, the experimenter measured the volume of juice that the participant had poured into the targeted container. During the experiment, the participants were not informed of the comparison between their poured volumes and the referenced volumes.
▪ Statistical analysis
Statistical analysis was performed using the statistical software package SPSS Version 19.0. The significance level α was set at 0.05. A paired t test was used to examine the differences between the targeted and the referenced volumes for each tumbler and goblet pairs.
Results and Discussion
Table 1 shows the paired t test results, indicating that two container types (tumbler and goblet) resulted in significant differences between the targeted and the referenced volumes (all p < .005). The mean (SD) amounts of juice that participants poured into the tall, slender containers were 112.2 (15.4) mL for the tumbler and 146.6 (26.3) mL for the goblet, whereas those for the corresponding short, wide containers were 93.4 (18.9) and 134.5 (26.1) mL, respectively.
| Containers | Characteristics | Perceived volumes (mL) | t | Significance |
|---|---|---|---|---|
| Tumbler | tall-slender | 146.6 (26.3) | 3.270 | p<0.005 |
| short-wide | 134.5 (26.1) | |||
| Goblet | tall-slender | 112.2 (15.4) | 6.990 | p<0.001 |
| short-wide | 93.4 (18.9) |
Table 1: Results of the paired t test for the paired container volumes (N=90).
In the present study, the tall, slender tumbler and goblet containers resulted in a significantly higher amount of poured juice than did the short, wide ones. The results of this study differ from that of Wansink and van Ittersum [5], which indicated that the short, wide tumbler would lead the participants to pour more wine (20%–30%) into the container compared with the tall, slender tumbler. This implies that the volume perceptions of the participants may be confounded by various factors. Therefore, the assertion that, “if people would like to reduce their alcohol intake, a tall, slender glass should be used [5]”, may not apply in all cases.
In the study by Wansink and van Ittersum [5], the tests were performed in a bar and the participants were allowed to hold the tumbler and check the poured wine volume at approximate eye-level. This would result in them viewing the height of the liquid from side-on; therefore, the horizontal–vertical illusion may dominate. The horizontal–vertical illusion means that when considering two straight lines with identical length (one vertical line and one horizontal line), the vertical line appears longer than the horizontal line. The illusion has been extended by Wansink, et al. [8] to explain why the short, wide tumbler would lead the participants to pour more wine into the tumbler compared with the tall, slender tumbler.
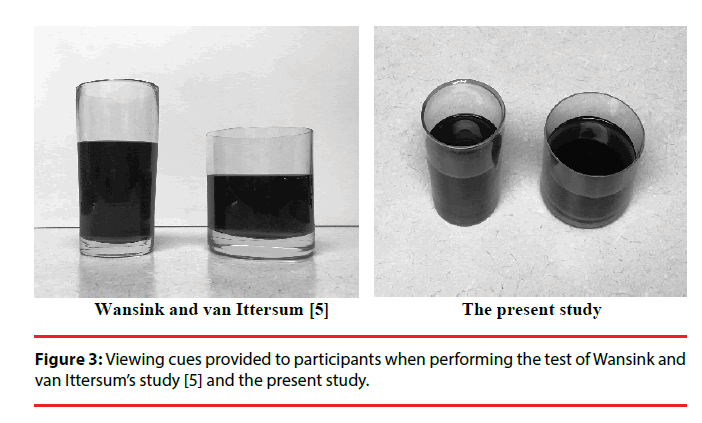
Figure 3 shows an example and demonstrates the view from a participant with a height of 168 cm, and compared with the view from the study of Wansink and van Ittersum [5], which tests were basically taken from a pourer or a waiter viewpoint. In the current study, the participants were asked to sit behind the table; thus, a consumer viewpoint was adopted. Nelson, et al. [13] found that when seated at a dining table the typical angle for viewing a plate of food is approximately 42°. The case may be similar to that of this study. In terms of the participant’s sight, cues from the container diameter were more visible than were those from the container height. That is, rather than the height level of the containers, the caliber of the container provided more visual information to the participants. This may induct the participants to overestimate the volume of the short, wide tumbler, thus less liquid was poured than the tall, slender tumbler, as shown in Table 1. It was interesting to note that, contrary to the finding of Piaget [6], the volume of a cup was perceived by the cup diameter of the liquid in this study, whereas the cup height was relatively ignored. This can also explain the effect of goblet elongation found in this study. The existed phenomenon of difference between the targeted and the referenced liquid volumes might be attributed to the size of the cup caliber; however, the real mechanism of visual illusion or cue is not completely clear and needs further investigation.
Figure 3: Viewing cues provided to participants when performing the test of Wansink and van Ittersum’s study [5] and the present study.
Notably, in the study by Wansink and van Ittersum [2], the participants were asked to pour a given amount of wine, whereas in the current study, a paired test of two containers (either tumblers or goblets) was performed. The paired method was designed to eliminate participants’ unfamiliarity regarding volume perception and to adequately control for individual errors. However, one consequence of this is that the effect of the optical illusions may be doubled. That is, after judging the juice volume in the referenced container (first illusion), the participants poured the judged volume into the targeted container (second illusion). This is a potential limitation in our study and merits further clarification. However, the experimental setting using the paired comparison was substantially reasonable and effective for preliminarily identifying the effect of cup elongation.
Conclusion
The present study extended previous findings [2,5] regarding consumption volumes for cups affected by optical illusions, by examining the effects of tumbler and goblet elongation (short, wide vs. tall, slender) on consumers’ volume perception. The results show an effect of container elongation for the two container types on participants’ volume perception. Contrary to the results of the previous studies, the short, wide tumbler and goblet resulted in less volume poured than did the tall, slender containers. The opposite results in the tumbler and goblet in this study compared with those of the previous study may be attributed to different viewing positions. The findings imply that container volume perceptions are not only influenced by the elongation variable but also by viewing position.
Acknowledgement
This study was partly supported by funding from the Ministry of Science and Technology (MOST), Taiwan, grant no. MOST 101-2815-C-131- 011-E. This funding is gratefully acknowledged.
References
- Raghubir P, Krishna A. Vital dimensions in volume perception: can the eye fool the stomach? J. Mark. Res 36, 313-326 (1999).
- Wansink B, van Ittersum K. Shape of glass and amount of alcohol poured: comparative study of effect of practice and concentration. BMJ 331(7531), 24-31 (2005).
- Wansink B, van Ittersum K. Spoons systematically bias dosing of liquid medicine. Ann. Intern. Med 152, 66-67 (2010).
- Wansink B. Can package size accelerate usage volume? J. Mark 60, 1-14 (1996).
- Wansink B, van Ittersum K. Bottoms up! The influence of elongation on pouring and consumption volume. J. Consum. Res30, 455-463 (2003).
- Piaget J. Quantification, conservation, and nativism. Science 162, 976-979 (1968).
- Wansink B, Cardello A, North J (2005) Fluid consumption and the potential role of canteen shape in minimizing dehydration. Mil. Med170, 871-873.
- Wansink B, Van Ittersum K, Painter JE. Ice cream illusions: bowls, spoons, and self-served portion sizes. Am. J. Prev. Med31(3), 240-243 (2006).
- Raudsepp J, Djupsjöbacka M. Handgrip Maximum Force and the Visual Horizontal–Vertical Illusion. Perception34(4), 421-428 (2005).
- Wansink B, Painter J, North J. Bottomless bowls: why visual cues of portion size may influence intake. Obes. Res 13(1), 93-100 (2005).
- Lan TL. The effect of container elongation on consumers' perception. Master Dissertation, Shih Hsin University, New Taipei, Taiwan (2008).
- Szocs C, Lefebvre S. Spread or stacked? Vertical versus horizontal food presentation, portion size perceptions, and consumption. J Bus Res (2017).
- Nelson M, Atkinson M, Darbyshire S. Food photography I: the perception of food portion size from photographs. Br. J. Nutr 72(5), 649-663 (1994).
