Research Article - Clinical Investigation (2020) Volume 10, Issue 1
Characteristics of diabetic ketoacidosis in adult patients in Bahrain
- Corresponding Author:
- Husain Taha Radhi
E-mail: husaintaha74@yahoo.com;
Maryam Abdalla El-Amin
E-mail: dr.maryamabdalla@hotmail.com;
Aysha Asif Sarwani
E-mail: ayshasif@hotmail.com;
Fatema Husain Mandeel
E-mail: dr.mandeel124@gmail.com
Submitted: 31 January 2020; Accepted: 14 February 2020; Published online: 25 February 2020
Abstract
Introduction: DKA has long been considered and studied as a complication of type 1 diabetes in children, only a few studies showed the magnitude of the DKA among adults and type 2 DM. Objective: To evaluate the burden of adult admissions with DKA in Salmaniya Medical Complex-Bahrain, and try to identify the different trends. Methods: Retrospective study; data collected from medical records of adult patients, age 14 and above, who were admitted to Salmaniya medical complex with DKA in the period between January 2017 to December 2018 and fulfilled our inclusion criteria. The data included basic demographic information, and progress during admission. Results: We included 224 DKA admissions, the median age was 31.2 years, the rate of readmission was high as 33 patients were responsible for 102 admissions, mostly type 1 (93.5%) (p-value=0.011). In the analysis, we divided them into subgroups of new diagnoses 32 (14.3%), type 1 DM 147 (65.6%), type 2 DM 45 (20.1). Type 2 DM had higher comorbidities 25 (55.6%) (p-value<0.006), and higher antibiotic use 30 (66.7%) (p-value=<0.0001). Type 2 DM with DKA had 9.5 times higher risk for mortality compared to Type 1 DM with DKA, interestingly type 1 DM group had significantly lower hospital length of stay than the rest groups (2.7 vs 5.3 and 5.0) days. The total mortality was 5 (2.2%) Conclusion: DKA admissions are associated with significant morbidity, effort must be targeted at reducing the number of admissions, and mortality, possibly by enforcing health education, offering psychosocial support, creating policies to ensure continuous insulin supply and involving the primary care centers in the management of hyperglycemia and early DKA.
Keywords
diabetes • diabetic ketoacidosis • Gulf region
Abbreviations
DM: Diabetes Mellitus; DKA: Diabetic Ketoacidosis
Introduction
Diabetic Ketoacidosis (DKA) is the most common and serious complication of diabetes worldwide [1]. In the Middle East region, mostly Arabs, it is estimated there are around 64,000 cases of type 1 diabetes, with an annual incidence of 10,700 cases [2]. Bahrain has a high prevalence rate of Diabetes, reached up to 48% in some populations [3]. H. Zayed conducted a descriptive quantitative study over 46 years in the Arab world to determine the rate of DKA in type 1 diabetes patients. The rate ranged from 17% to 100% with an overall rate of 46.7% [4].
Although the mortality rate of DKA has fallen significantly in the last two decades from 7.96% to 0.67%, but in developing countries, it is still high [5]. DKA is a metabolic derangement characterized by the triad of hyperglycemia, ketosis, and acidosis (bicarbonate <15 mmol/ l and arterial blood PH <7.3) mainly in type 1 diabetes patients, however, type 2 diabetes with metabolic decompensation could develop DKA [6,7]. The two most common precipitating factors are infections and inadequate insulin therapy, other factors, including myocardial infection, pancreatitis, trauma, cerebrovascular accident, alcohol, and drug abuse, provoke the release of counterregulatory hormones and might result in DKA [8,9].
Research shows that the optimal hospital site to manage DKA patients either general medical ward or Intensive Care Unit (ICU), should be based on the clinical prognostic indicators and the local availability of hospital resources. In some studies, up to 7.6% of DKA patients required ICU admission causing significant mortality, morbidity, and healthcare expenditure [10,11]. As most DKA cases occur in patients with a known history of diabetes, this acute metabolic complication can be prevented by patients’ education, training healthcare professionals, annual screening for complications, proper medications with approved indications, nutritionist visits, psychosocial support, and frequent blood glucose measurement. Many studies reported that improvement in the quality of care for diabetes was reflected by a decrease in diabetes-related hospitalizations [12-14]. A similar concept in Salmaniya Medical Complex was conducted as a weekly open clinic for diabetic patients that offer advice about sugar control and management.
The aim of our study was to evaluate the clinical characteristics, prevalence, associated risk factors, and outcome of patients with DKA.
Methods
• Setting: The study was conducted in Salmaniya Medical Complex, which is the biggest tertiary teaching center and the main government hospital in Bahrain, located in the capital city of Manama
• Sample/population: All adult patients, age 14 and above admitted in the period from 1st January 2017 to 31st December 2018 in Salmaniya Medical Complex with the diagnosis of DKA
• Design: Retrospective and descriptive
• Eligibility and exclusion criteria:
I. Included all patients 14 years old and above with DKA diagnosis according to NICE 2015 guidelines
a) Acidosis (indicated by blood pH below 7.3 or plasma bicarbonate below 18 mmol/L and
b) Ketonemia (indicated by blood beta-hydroxybutyrate above 3 mmol/L) or ketonuria (++ and above on the standard strip marking scale)
II. Excluded patients less than 14 years of age, not fulfilling DKA criteria or DKA diagnosis was ruled out during admission
III. For the characteristics of DKA severity, we used pH (7.25-7.30, 7.00-7.24, <7.00) and bicarbonate (18-15, >15-10, <10) for mild, moderate, and severe respectively
• Data collection: An Excel data collection form was developed. The study was approved by the Secondary Health Care Research Committee, Salmaniya Medical Complex, Bahrain. The form included the patients’ age, nationality, gender, type of diabetes, length of hospital stay, associated comorbidities, precipitating factors, laboratory values, ICU admission, and their outcome. The major source of the patients’ data was the patients’ medical records both paper and electronic. Meticulous care was taken with the identification of data and data entry
• Statistical methods used in the analysis: The data were analyzed with IBM SPSS 25 and Rstudio 1.1.4. The descriptive statistics were performed to all variables as total and across the three types of patients (New, type 1, type 2). The descriptive statistics included frequencies and percentages for categorical variables, mean, median, standard deviation, and 95% CI for the continuous variables. The inferential correlational analysis was performed using the Chi squares test for independence, for the categorical variables to explore the significant differences among categories proportions. The one-way Analysis of Variance (ANOVA) test with or without Brown-Forsythe correction was used to explore the significant differences among categories means
The set Alpha level was 0.05 kept as a cutoff point to inference the statistical significance for all the performed statistical tests.
Results
We had 301 admissions labeled as DKA between 2017- 2018, out of which 77 were excluded due to missing data or not fulfilling the inclusion criteria. The final sample contained 224 admissions in 154 patients.
There was a high readmission rate, one patient was admitted 13 times over the course of 2 years, another was admitted 8 times, followed by two patients admitted 6 times each, and another three admitted 4 times each, then 5 patients admitted 3 times each, all the previous patients were type 1 DM.
The last category was 21 patients admitted twice and only two of them typed 2 DM, another was admitted as new in the first admission and as type 1 in the subsequent admission and was not included in readmission analysis. So, 33 patients were responsible for 102 admissions out of 224 (45.5% of the total admissions). Around 94% of the readmissions occurred for type 1 patients with a statistically significant difference from the rest groups (93.5% vs. 0%, 6.5%) as confirmed with Chi-square test (X2=6.3, df=1, p=0.011) (Table 1).
| Number of patients with readmissions | ||
|---|---|---|
| DM type | N | % |
| New | 0 | 0% |
| Type 1 | 29 | 93.50% |
| Type 2 | 2 | 6.50% |
| p-value | 0.011 | |
Table 1. Number of patients with readmissions according to DM type, in Salmaniya Medical Complex, Bahrain
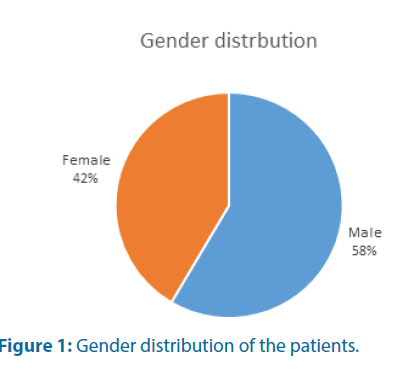
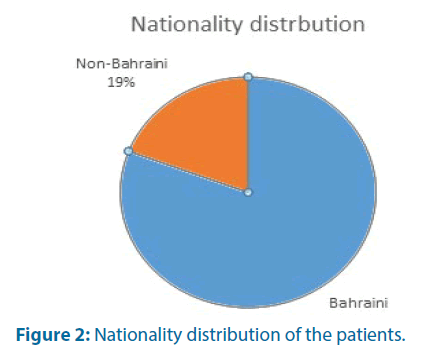
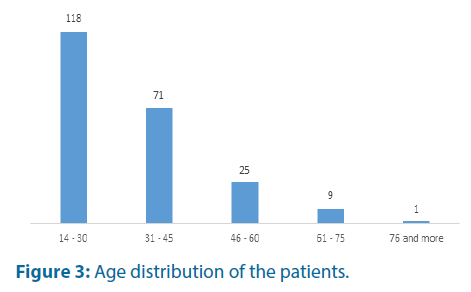
Both genders were similarly represented (58.5% vs. 41.5%) for males and females respectively (Table 2 and Figure 1). The majority of these patients were Bahraini (n=181, 80.8%) whereas the rest were from 13 other nationalities (n=43, 19.1%) (Table 2 and Figure 2). On average, these subjects were young with a mean age of 31.2 years. Those aged between 14 and 30 years’ fairly form half of the subjects (Table 2 and Figure 3).
| Variable | Categories | New | Type 1 | Type 2 | Total |
|---|---|---|---|---|---|
| Gender | Male | 21 (16%) | 85 (64.9%) | 25 (19.1%) | 131 (58.5%) |
| Female | 11 (11.8%) | 62 (66.7%) | 20 (21.5%) | 93 (41.1%) | |
| p-value | 0.8355 | 0.9592 | 0.621 | ||
| Nationality | Bahraini | 18 (9.9%) | 127 (70.2%) | 36 (19.9%) | 181 (80.8%) |
| Non-Bahraini | 14 (32.6%) | 20 (46.5%) | 9 (20.9%) | 43 (19.1%) | |
| p-value | 0.2498 | 0.0685 | 0.569 | ||
| Age group | 14-30 | 17 (14.4%) | 100 (84.7%) | 1 (0.8%) | 118 (52.7%) |
| 31-45 | 12 (16.9%) | 41 (57.7%) | 18 (25.4%) | 71 (31.7%) | |
| 46-60 | 3 (12%) | 6 (24%) | 16 (64%) | 25 (11.2%) | |
| 61-75 | 0% | 0% | 9 (100%) | 9 (4.0%) | |
| 76 and more | 0% | 0% | 1 (100%) | 1 (0.4%) | |
| p-value | <0.0001 | <0.0001 | <0.0001 | ||
Table 2. Demographic characteristics of the admissions with DKA according to subgroups of newly diagnosed, type 1 DM, type 2 DM, in Salmaniya Medical Complex, Bahrain (N=224)
We divided the sample into subgroups of newly diagnosed DM, type 1 DM, and type 2 DM to compare the characteristics among different subgroups.
Both males and females show very similar chances to develop DKA in across the three subgroups of DM with no statistically significant differences. Likewise, the subject’s nationality bears no effect on the chance to develop DKA across the three DM types. However, those who developed DKA in the newly diagnosed and type 1 patient tend to be younger than those develop DKA with type 2 (Table 2).
Insulin (as multiple daily injections or an insulin pump) was the most prescribed medication upon discharge across all subgroups (87.5%) (Table 3).
| Insulin | Insulin+OHA | OHA | |
|---|---|---|---|
| New | 22 (75.8%) | 6 (20.7%) | 1 (3.4%) |
| Type 1 | 136 (100%) | 0 | 0 |
| Type 2 | 24 (55.8%) | 17 (39.5%) | 2 (4.7%) |
| Total | 182 (87.5%) | 23 (11.1%) | 3 (1.4%) |
| p-value | <0.0001 | ||
Table 3. Medications prescribed to patients with DKA upon discharge, in Salmaniya Medical Complex, Bahrain
While assessing the precipitating factors for DKA, missed insulin dose was a statistically significant trigger for DKA in type 1 and in type 2, due to non-compliance, nonavailability or malfunction of the insulin pump (Table 4).
| New | Type 1 | Type 2 | Total | ||||
|---|---|---|---|---|---|---|---|
| Missed insulin dose/s | 0 | 50 | 71.40% | 15 | 46.90% | 65 (57%) | |
| Cardiac ischemia | 0 | 0 | 1 | 3.10% | 1 (0.9%) | ||
| Infection | 5 | 41.70% | 12 | 17.10% | 9 | 28.10% | 26 (22.8%) |
| Referred for hyperglycemia | 5 | 41.70% | 1 | 1.40% | 4 | 12.50% | 10 (8.8%) |
| other | 2 | 16.70% | 7 | 10% | 3 | 9.40% | 12 (10.5%) |
| Total | 12 (100%) | 70 (100%) | 32 (100%) | ||||
Table 4. Precipitating factors for DKA according to Subgroups, in Salmaniya Medical Complex, Bahrain
Fairly one-third of the sample (n=83, 37.1%) presented with comorbidities. Type 2 DM patients had the highest comorbidities (n=25, 55.6%), like hypertension and dyslipidemia, with a statistically significant difference compared to the rest two groups (p=0.006) (Table 5).
| Type of DM | Prevalence of comorbidities n (%) |
|---|---|
| New | 7 (21.9%) |
| Type 1 | 51 (34.7%) |
| Type 2 | 25 (55.6%) |
| Total | 83 (37.1%) |
| p-value | <0.006 |
Table 5. Comorbidities among patients admitted with DKA, in Salmaniya Medical Complex, Bahrain
Seemingly the three groups have very comparable glycemic control profiles. Despite the casual variation in their mean random blood sugar on admission, these differences were not statistically significant. Likewise, the newly diagnosed group had the lowest HbA1c level on average (10.5% ± 5.4%), however, this difference was not statistically significant (Table 6).
| Type of DM | RBS Mean (± SD) | HbA1c% Mean (± SD) |
|---|---|---|
| New | 26.7 (± 12.3) | 10.5 (± 5.4)% |
| Type 1 | 27.2 (± 9.6) | 10.6 (± 4.5)% |
| Type 2 | 28.7 (± 10.1) | 11.5 (± 5.6)% |
| Total | 27.4 (± 10.1) | 10.8 (± 4.9)% |
| p-value | 0.629 | 0.3 |
Table 6. Mean comparisons of patients’ glycemic control profile on admission, in Salmaniya Medical Complex, Bahrain (N=224)
There was no relationship between the type of DM and patients’ hematologic profile on admission except for the hemoglobin level. Type 2 DM patients presented with significantly lower levels of hemoglobin when compared to the other two types (12.5 vs. 14.4 and 13.5) (Tables 7 and 8).
| Type of DM | WBC Mean (± SD) | Hb Mean (± SD) | Platelets Mean (± SD) |
|---|---|---|---|
| New | 11.2 (± 5.8) | 14.4 (± 2.4) | 316.6 (± 221.4) |
| Type 1 | 11.6 (± 5.5) | 13.5 (± 1.8) | 336 (± 98.7) |
| Type 2 | 11.8 (± 7.1) | 12.5 (± 2.6) | 307.8 (± 127.4) |
| Total | 11.5 (± 5.9) | 13.4 (± 2.1) | 327.5 (± 128.6) |
| p-value | 0.931 | <0.004 | 0.384 |
Table 7. Comparison of the hematologic profile in all the subgroups presenting with DKA, in Salmaniya Medical Complex, Bahrain (N=224)
| New | Type 1 | Type 2 | |
|---|---|---|---|
| New | 1 | ||
| Type 1 | 0.18 | 1 | |
| Type 2 | 0.006 | 0.056 | 1 |
Table 8. Post hoc pair-wise comparison of the means
Type 2 DM group recorded significantly higher levels of serum urea on admission when compared to other groups (11.4 vs. 6.7 and 7.3). However, serum creatinine levels showed some variations among the three groups with the highest level in Type 2 DM, but it was not statistically significant (Tables 9 and 10).
| Type of DM | Serum Urea Mean (± SD) | Serum Creatinine Mean (± SD) |
|---|---|---|
| New | 6.5 (± 3.8) | 75.5 (± 34.8) |
| Type 1 | 7.3 (± 4.6) | 77.0 (± 73.9) |
| Type 2 | 11.4 (± 9) | 100.6 (± 85.3) |
| Total | 8.0 (± 5.9) | 81.6 (± 72.6) |
| p-value | 0.001 | 0.144 |
Table 9. DM type and their renal function profile on admission in Salmaniya Medical Complex, Bahrain (n=224)
| New | Type 1 | Type 2 | |
|---|---|---|---|
| New | 1 | ||
| Type 1 | 0.662 | 1 | |
| Type 2 | 0.005 | 0.014 | 1 |
Table 10. Post hos Urea comparisons across DM types
Type 2 DM patients recorded significantly lower Na+ levels on average during their admission when compared to Type 1 DM (131.6 vs. 134.1) respectively. However, there was no significant difference between the newly diagnosed and Type 1 (Tables 11 and 12). Very similar results were observed in their Chloride levels. Again, Type 2 DM group recorded the lowest level on average with a statistically significant difference (96 vs. 99.6 and 98.6) (Tables 11 and 13). As for the Potassium level, the newly diagnosed DM patients had significantly lower levels when compared to Type 1 and 2 (4.3 vs. 5.1 and 5.1) (Tables 11 and 14).
| Type of DM | Na+Mean (± SD) | K+Mean (± SD) | Cl-Mean (± SD) |
|---|---|---|---|
| New | 132.9 (± 6.7) | 4.3 (± 0.9) | 99.6 (± 7.5) |
| Type 1 | 134.1 (± 4.6) | 5.1 (± 0.7) | 98.6 (± 5.8) |
| Type 2 | 131.6 (± 5.8) | 5.1 (± 0.8) | 96.0 (± 6.6) |
| Total | 133.4 (± 5.3) | 5.0 (± 0.8) | 98.2 (± 6.3) |
| p-value | 0.017 | <0.0001 | 0.026 |
Table 11. DM type and their serum electrolytes profile on admission
| New | Type 1 | Type 2 | |
|---|---|---|---|
| New | 1 | ||
| Type 1 | 0.509 | 1 | |
| Type 2 | 0.483 | 0.014 | 1 |
Table 12. Post hos Sodium level comparisons across DM types
| New | Type 1 | Type 2 | |
|---|---|---|---|
| New | 1 | ||
| Type 1 | 0.699 | 1 | |
| Type 2 | 0.041 | 0.048 | 1 |
Table 13. Post hos Chlorine level comparisons across DM types
| New | Type 1 | Type 2 | |
|---|---|---|---|
| New | 1 | ||
| Type 1 | <0.0001 | 1 | |
| Type 2 | <0.0001 | 0.957 | 1 |
Table 14. Post hos Potassium level comparisons across DM types
The three groups had similar degrees of academia on admission, as there was no statistical difference among their mean pH, HCO3, and serum ketone level. However, they did differ significantly in their levels of anion gap as the newly diagnosed group had a significantly lower level on average when compared with type 1 and 2 (26.03 vs. 29.02 and 29.38) respectively (Tables 15 and 16).
| Type of DM | pH Mean (± SD) | HCO3 Mean (± SD) | Anion gap Mean (± SD) | Serum Ketone Mean (± SD) | Urine Ketone Mean (± SD) |
|---|---|---|---|---|---|
| New | 7.17 (± 0.15) | 11.6 (± 4.4) | 26.03 (± 5.8) | 2.8 (± 0.42) | 2.9 (± 0.49) |
| Type 1 | 7.16 (± 0.14) | 11.5 (± 4.4) | 29.02 (± 6) | 2.6 (± 0.62) | 2.9 (± 0.44) |
| Type 2 | 7.14 (± 0.17) | 11.2 (± 4.3) | 29.38 (± 5.6) | 2.7 (± 0.65) | 2.5 (± 1) |
| Total | 7.15 (± 0.14) | 11.5 (± 4.4) | 28.67 (± 5.9) | 2.7 (± 0.60) | 2.8 (± 0.64) |
| p-value | 0.771 | 0.903 | 0.024 | 0.201 | 0.004 |
Table 15. DM type and their acid-base control profile on admission in Salmaniya Medical Complex, Bahrain (N=224)
| New | Type 1 | Type 2 | |
|---|---|---|---|
| New | 1 | ||
| Type 1 | 0.026 | 1 | |
| Type 2 | 0.039 | 0.937 | 1 |
Table 16. Post hos Anion gap comparisons across DM types
There was no statistically significant relationship between the type of DM and the severity of the metabolic acidosis (Tables 17 and 18).
| Mild (7.25-7.30) | Moderate (7.00-7.24) | Severe (<7.00) | |
|---|---|---|---|
| New | 3 (13.6%) | 15 (68.2%) | 4 (18.2%) |
| Type 1 | 37 (31.1%) | 60 (50.4%) | 22 (18.5%) |
| Type 2 | 8 (24.2%) | 14 (42.4%) | 11 (33.3%) |
| Total | 48 (27.6%) | 89 (51.1%) | 37 (21.3%) |
| p-value | 0.149 | ||
Table 17. Severity of metabolic acidosis (as expressed with pH level) among all subgroups in Salmaniya Medical Complex, Bahrain
| Mild (15-18 mEq/L) | Moderate (10-14 mEq/L) | Severe (<10 mEq/L) | |
|---|---|---|---|
| New | 6 (20.0%) | 13 (43.3%) | 11 (36.7%) |
| Type 1 | 27 (19.7%) | 71 (51.8%) | 39 (28.5%) |
| Type 2 | 12 (27.9%) | 15 (34.9%) | 16 (37.2%) |
| Total | 45 (21.4%) | 99 (47.1%) | 66 (31.4%) |
| p-value | 0.372 | ||
Table 18. Severity of metabolic acidosis (as expressed with HCO3 level) across the DM types
Nearly 40% 0f the sample received at least one dose of antibiotic during their hospitalization, out of which type 2 DM patients had the highest proportion in comparison to other groups (66.7% vs. 30.6% and 40.6%) with statistically significant difference (Table 19).
| Type of DM | Use of Antibiotics n (%) |
|---|---|
| New | 13 (40.6%) |
| Type 1 | 45 (30.6%) |
| Type 2 | 30 (66.7%) |
| Total | 88 (39.3%) |
| p-value | <0.0001 |
Table 19. Use of antibiotics during DKA admission according to type
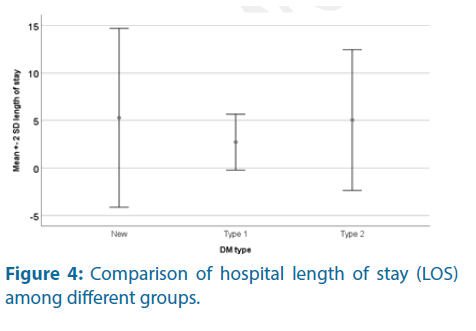
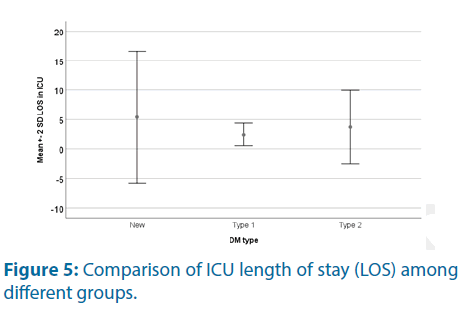
Type 1 DM group had significantly lower hospital length of stay. In terms of ICU admission, there was no significant difference among the three groups in the rate or length of stay.
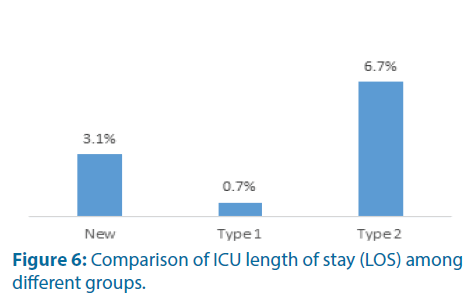
The total mortality rate was 2.2%. Type 2 DM group had a statistically significantly higher mortality rate compared to the Type 1 DM group (6.7% vs. 0.7%). Type 2 DM with DKA had 9.5 times higher risk for mortality compared with Type 1 DM with DKA. There was no significant difference in mortality rates between the Type 2 and the newly diagnosed patients (6.7% vs. 3.1%) (Tables 20-22 and Figures 4-6).
| Type of DM | Hospital Length of stay Mean (± SD) | ICU admission n (%) | Length of stay in ICU Mean (± SD) | Mortality |
|---|---|---|---|---|
| n (%) | ||||
| New | 5.3 (± 4.7) | 5 (15.6%) | 5.4 (± 5.6) | 1 (3.1%) |
| Type 1 | 2.7 (± 1.4) | 13 (8.8%) | 2.4 (± 0.96) | 1 (0.7%) |
| Type 2 | 5.0 (± 3.7) | 4 (8.9%) | 3.7 (± 3.1) | 3 (6.7%) |
| Total | 3.5 (± 2.9) | 22 (9.8%) | 3.3 (± 3.1) | 5 (2.2%) |
| p-value | <0.0001 | 0.533 | 0.425 | 0.055 |
Table 20. DM type and their clinical outcomes
| New | Type 1 | Type 2 | |
|---|---|---|---|
| New | 1 | ||
| Type 1 | 0.014 | 1 | |
| Type 2 | 0.993 | 0.001 | 1 |
Table 21. Post hos length of stay comparisons across DM types
| New | Type 1 | Type 2 | |
|---|---|---|---|
| New | 1 | ||
| Type 1 | 0.299 | 1 | |
| Type 2 | 0.477 | 0.027 | 1 |
Table 22. Post hos mortality comparisons across DM types
Significance of the Study
Ours is a pioneer study in the region concentrating on adult DKA characteristics while the focus of previous studies has been on childhood and adolescent diabetes with its complications.
When we searched for other studies in Bahrain for comparison, Al-Baharna M and Whitford. D, conducted a study in Bahrain Defense Hospital, looking at the overall diabetic care provided in hospital setting, it, however, did not specifically look at DKA as a complication of diabetes in adult patients [15], thus this study being the first in the country to look at the various characteristics of adult patients presenting with DKA.
Previously a systemic review in the middle east region studied different aspects of DM in pediatrics, but the data from Bahrain was limited [16].
A specific study on DKA in the middle-eastern region was published in Qatar in 2016, where they tried to gather data from 22 Arab nations over a period of 46 years to establish the rate of DKA, however; only 12 countries had sufficient data to be included in the study. No data, however, was available from Bahrain [4].
Discussion
One of the common, potentially serious, and avoidable complications of diabetes mellitus is DKA. It can be the first presentation of diabetes, and with the diagnosis being not so apparently straight forward, it is often missed, and thus need to be considered with a high degree of suspicion [17].
Right from the beginning of data collection, we noticed that the number of the sample was significantly higher than what was reported in similar studies, both regional and international.
In a study in Auckland over an eight-year period, they had only 125 admissions with DKA, the mortality rate was 2.4% and 10.4% patients had type 2 diabetes. Thirty-eight patients needed intensive care unit treatment for variable reasons, and 25% of the patients had readmissions. In our study, the total mortality is comparable with 2.2%.20.1% are type 2 patients, and 33 patients had readmissions contributing to 45.5% of the total readmissions [18]. The high number of admissions could be due to the high prevalence of DM in Bahrain, shown in some studies to reach 48% in some populations [3].
The high rate of readmissions in type 1 DM was contributing to the bulk of admissions in this subgroup, patients should be educated about their disease to avoid the common DKA triggers i.e. missing insulin, lack of compliance, stress including infection requiring higher doses, and exploring their social circumstances and offer more psychosocial support.
Despite having the largest number of admissions, type 1 DM has the shortest length of hospital stay and the lowest mortality rate.
We noticed in our study that type 2 DM with DKA tend to be older at presentation, with higher comorbidities, impaired baseline renal function contributing to their higher mortality, they also have a higher chance of being on antibiotics despite no statistically significant difference in leukocyte count in the subgroups. Further studies need to evaluate the correlation between higher antibiotic usage in type 2 DM.
The lower hemoglobin levels noticed among type 2 DM could be due to older age and presence of comorbidities.
Insufficient insulin and underlying infections are considered common triggers for developing DKA [19]. In our study insulin missing 65 (57%) was more common than infectious cause 26 (22.8%), there have been similar results reported in comparable studies on DKA.
Different studies have demonstrated 21%-66% of patients with missed insulin doses and 20%-73% of the patients with underlying infections being the cause of DKA [20-22].
A study in Libya, similar to our study, the most common causative factor was missed insulin dose in 35% of the patients included in the study, whereas infectious cause was the trigger in 20% of the patients [23].
In a study conducted in King Abdulaziz University Hospital by Qari FA, in KSA in 2002, different precipitating factors for DKA due to medical and social reasons were identified in a group of 68 patients over a two-year period, with the mean age of patients around 22.5 years, and a male: female ratio of 1.4:1. Poor compliance has been identified as the main trigger (54.4) with infection being the second common inducing factor (28%). The mortality rate was found to be 2.9% [24].
Moving on to the South Asian region for comparison, in a study in Pakistan by Jabbar et al., 57 patients were reviewed being admitted as DKA, of which 49 patients had type 2 DM and 40 patients were on OHA and 9 being on no treatment. The common predisposing factor was found to be an infection (63%), and 12 patients died showing a high mortality rate [25].
If we compare it with East Asian region, in a study over one-year period in China by Tan H et al., published on 2012, the target study population was adolescents and adults, they found 263 patients with DKA of whom 15.59% had type 1 DM and 67.68% had type 2 DM, while 22.81% were classified as newly diagnosed. They found infection to be the most common predisposing factor (39.16%), with non-compliance being the second trigger (25.5%) [26].
DKA as the first presentation has been shown to be of variable frequency, in a study by Ahuja W et al., 26% of patients presented with DKA as the first presentation of type 1 DM [27], while in our study 32 (14.3%) were reported, however, the frequency has shown to be high in Pakistani study (57%) [21] and low in Indian studies (10%- 11%) [20,22]. In Libyan study, it was shown to be 20% [23].
We found the mean HbA1c (10.8% ± 4.9%) comparable in all the subcategories of DKA, with a tendency to be lower in the newly diagnosed group. Comparing to Australia, a study by Holmes-Walker D and group, the effect of a transition support program in young patients with diabetes (age 15-25) was studied, where they found the initial mean HbA1c was 9.3% ± 2.17% [13].
Also, we found the overall mortality rate to be 2.2% which is lower than other comparative studies that have reported mortality rates in DKA patients, reported mortality rates ranged from 3.5% to 12% [20,22,23]. In a center from Pakistan, the mortality rate was as high as 23% due to multiple contributing factors [27].
There is no specific scoring system to predict mortality in DKA. Different studies have referenced different variables (biochemical signs such as high lactate, clinical signs such as altered sensorium, depressed mental state, systolic hypotension, development of renal failure and pneumonia) as predictors of mortality. A validated method accepted globally should be created to predict the risk of mortality in DKA patients [27]. In our study, we established a link between higher mortality and type 2 DM, with older age and multiple comorbidities, and these variables should be included in such a score.
Limitations of the Study
The duration of the study was limited to two years in one center, despite that the sample number was comparable to other similar studies. Expanding the study in the future is highly recommended and might help explore different trends.
Another obstacle we faced was the missing filing and documentation, the hospital at the study period was transitioning from a paper system to an electronic system and sometimes led to unavailable data, however, we expect this issue to be resolved in subsequent years. Unfortunately, that meant we could not include some variables like presenting complaints in our study as the data was not available for all the patients.
Acknowledgment
We would like to thank Mr. Ridha al-Hammam and Dr. Riyadh al-Merbati for their valuable contribution to this paper.
Disclaimer
The authors declare there was no conflict of interest in this study.
Conclusion and Recommendations
Bahrain is a small country in the heart of the Gulf region, has a high prevalence of diabetes, and that is reflected in the high rate of admissions with DKA, in general, more admissions are type 1 DM, with high readmission rate, but type 2 patients with DKA have more morbidity and mortality.
Effort must be targeted at decreasing the number of admissions and mortality, possibly by enforcing health education, offering psychosocial support, creating policies to ensure continuous insulin supply and involving the primary care centers in the management of hyperglycemia and early DKA, or even consider establishing a tertiary center for endocrine diseases.
Further studies can explore the high rate of readmissions for type 1, investigate the management of type 2 comorbidities and discuss the role of antibiotics in the treatment.
References
- Sola E, Solá E, Garzón S, et al. Management of diabetic ketoacidosis in a teaching hospital. Acta Diabetol 43: 127-130 (2006).
- Federation ID-IDF diabetes atlas. Brussels: International Diabetes Federation (2013).
- Al-Mahroos F, McKeigue PM. High prevalence of diabetes in Bahrainis. Associations with ethnicity and raised plasma cholesterol. Diabetes Care 21: 936-942 (1998).
- Zayed H. Epidemiology of diabetic ketoacidosis in Arab patients with type 1 diabetes: a systematic review. Int J Clin Pract 70: 186-195 (2016).
- Otieno CF, Kayima JK, Omonge EO, et al. Diabetic ketoacidosis: risk factors, mechanisms and management strategies in sub-Saharan Africa: a review. East Afr Med J 82: 197-203 (2005).
- Smiley D, Chandra P, Umpierrez GE. Update on diagnosis, pathogenesis and management of ketosis-prone Type 2 diabetes mellitus. Diabetes Manag (Lond) 1: 589-600 (2011).
- Umpierrez GE, Kitabchi AE. Diabetic ketoacidosis: risk factors and management strategies. Treat Endocrinol 2: 95-108 (2003).
- Wright J, Ruck K, Rabbi R, et al. Diabetic ketoacidosis (DKA) in Birmingham, UK, 2000-2009: an evaluation of risk factors for recurrence and mortality. British J Diabet Vas Dis 9: 278-282 (2009).
- Naveed D, Bilal N, Nasir B, et al. Precipitating factors for diabetic ketoacidosis. Khyber Med Uni J 1: 6-8 (2009).
- Gershengorn HB, Iwashyna TJ, Cooke CR, et al. Variation in use of intensive care for adults with diabetic ketoacidosis. Crit Care Med 40: 2009-2015 (2012).
- Freire AX, Umpierrez GE, Afessa B, et al. Predictors of intensive care unit and hospital length of stay in diabetic ketoacidosis. J Crit Care 17: 207-211 (2002).
- Geiss L, Engelgau M, Pogach L, et al. A national progress report on diabetes: successes and challenges. Diabetes Technol Ther 7: 198-203 (2005).
- Holmes-Walker DJ, Llewellyn AC, Farrell K. A transition care programme which improves diabetes control and reduces hospital admission rates in young adults with Type 1 diabetes aged 15-25 years. Diabet Med 24: 764-769 (2007).
- Robbins JM, Thatcher GE, Webb DA, et al. Nutritionist visits, diabetes classes, and hospitalization rates and charges: the Urban Diabetes Study. Diabetes Care 31: 655-660 (2008).
- Al-Baharna MM, Whitford DL. Clinical audit of diabetes care in the bahrain defence forces hospital. Sultan Qaboos Univ Med J 13: 520-526 (2013).
- Saraswathi S, Al-Khawaga S, Elkum N, et al. A systematic review of childhood diabetes research in the middle east region. Front Endocrinol (Lausanne) 10: 1-19 (2019).
- Misra S, Oliver NS. Diabetic ketoacidosis in adults. BMJ 351: 1-5 (2015).
- Bagg W, Sathu A, Streat S, et al., Diabetic ketoacidosis in adults at Auckland Hospital, 1988-1996. Aust N Z J Me 28: 604-608 (1998).
- Umpierrez GE, Murphy MB, Kitabchi AE. Diabetic ketoacidosis and hyperglycemic hyperosmolar syndrome. Diabetes Spectrum 15: 28-36 (2002).
- Mahesh MG, Shivaswamy RP, Subhash-Chandra BJ, et al. The study of different clinical pattern of diabetic ketoacidosis and common precipitating events and independent mortality factors. J Clin Diagn Res 11: 42-46 (2017).
- Lone SW, Siddiqui EU, Muhammed F, et al. Frequency, clinical characteristics and outcome of diabetic ketoacidosis in children with type-1 diabetes at a tertiary care hospital. J Pak Med Assoc 60: 725-729 (2010).
- Seth P, Kaur H, Kaur M. Clinical profile of diabetic ketoacidosis: a prospective study in a tertiary care hospital. J Clin Diagn Res 9: 1-4 (2015).
- Elmehdawi RR, Ehmida M, Elmagrehi H, et al. Incidence and mortality of diabetic ketoacidosis in benghazi-libya in 2007. Oman Med J 28: 178-183 (2013).
- Qari FA. Precipitating factors for diabetic ketoacidosis. Saudi Med J 23: 173-176 (2002).
- Jabbar A, Farooqui K, Habib A, et al. Clinical characteristics and outcomes of diabetic ketoacidosis in Pakistani adults with Type 2 diabetes mellitus. Diabet Med 21: 920-923 (2004).
- Tan H, Zhou Y, Yu Y. Characteristics of diabetic ketoacidosis in Chinese adults and adolescents- teaching hospital-based analysis. Diabetes Res Clin Pract 97: 306-312 (2012).
- Ahuja, W, Kumar N, Kumar S, et al. Precipitating risk factors, clinical presentation, and outcome of diabetic ketoacidosis in patients with type 1 diabetes. Cureus 11: e4789 (2019).
