Research Article - Interventional Cardiology (2017) Volume 9, Issue 6
Accuracy of the new electrocardiogram algorithm in predicting localization of accessory pathways in patients with typical Wolff-Parkinson-White syndrome
- Corresponding Author:
- Si Dung Chu
School of Medicine and Pharmacy
Vietnam National University (Hanoi), Vietnam
Tel: +84906086168
E-mail: chudungsi@gmail.com, dr.swiss.zhu@gmail.com
Submitted: October 10, 2017; Accepted: October 24, 2017; Published online: October 30, 2017
Abstract
Objective: This study was to test the accuracy of the newly built electrocardiogram algorithm prospectively by us for the localizing accessory pathways (APs) in typcal Wolff-Parkinson-White (WPW) syndrome. Subject and methods: A new algorithm is proposed for localization of AP by 12 lead electrocardiograms (ECG) before radiofrequeny catheter ablation (RCFA) in 109 patients were compared with AP location confirmed by successful RCFA. Results: The new electrocardiogram algorithm for the localization of AP with high accuracy predicted by simple parameters such as delta wave polarity in lead V1, R/S ratio in V1, the QRS complex transition, delta wave polarity in at least 2/3 inferior leads (DII, DIII, aVF) and QRS complex morphology was Qrs (Qrs, qRs, qrS) in at least 1/3 inferior leads with high sensitivity and high specificity from 75% to 100%. Conclusion: The new ECG algorithms were high accuracy in predicting AP before intervention.
Keywords
Localization of accessory pathway, New ECG algorithm, WPW syndrome
Introduction
Wolff-Parkinson-White syndrome caused by ventricular pre-excitation via an accessory pathway that bypass the atrioventricular (AV) node, establishing a direct link between the atrium and the ventricle (called Kent Bundle); cause of the shortened PR interval, widened QRS complex and delta wave on the 12 lead- ECG [1,2].
Nowadays, RCFA of APs requires precise localization of the APs along the mitral and tricuspid annulus (gold standard) [2]; 12- lead ECG is the first step of great importance for localization of APs before intervention in patients with WPW syndrome, until now.
The data Obtained from the ECG parameters can be helpful the procedure time and fluoroscopy time were shorten [2,3].
In the world, there are many studies about ECG algorithms based on surface ECG have been published predicting locations of AP. However, some ECG algorithms had difficult parameters, some studies known that difficulty between other regions, and some algorithms were only focus on some locations [1,3-7]; In fact, we were enrolled to build a new ECG algorithm propectively for the locate to APs. Therefore, the purpose of this study was to test the accuracy of our new ECG algorithm for APs localization before intervention.
Subject and Methods
Study design
Observational, cross-sectional, prospective study.
Study contents
We studied 109 patients with typical WPW syndrome have a single of APs and successful RCFA from June 2016 to May 2017 years at Vietnam Heart Institute, Bachmai Hospital.
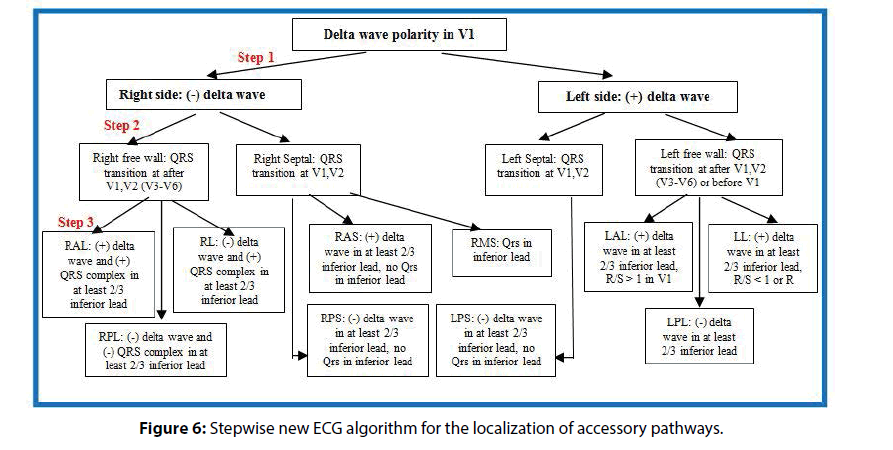
We were enrolled to builed a new ECG algorithm for localizing APs by 189 patients with typical WPW syndrome who had a single anterograde APs identified by RCFA from January 2001 to June 2016, the our new algorithm derived from some simple parameters such as predicting Left side or right side pathways by positive or negative delta waves in leads V1, Anterior or posterior sites pathways by positive or negative delta waves in at least 2/3 inferior lead (DII, DIII, aVF), Septal or free wall lateral sites pathways by QRS transition at leads V1,V2 or after V1,V2 (V3-V6)/before V1 (the right free wall had QRS transition at after leads V1,V2; the left free wall had QRS transition at after leads V1,V2, or before V1); Difference between right lateral and right posterolateral by positive or negative QRS complex in at least 2/3 inferior lead; Difference between left anterolateral and left lateral by R/S>1 or R/ S<1, R morphology. Midseptal region had specify QRS morphology (Qrs, qRs, qrS) in at least 1/3 inferior lead.
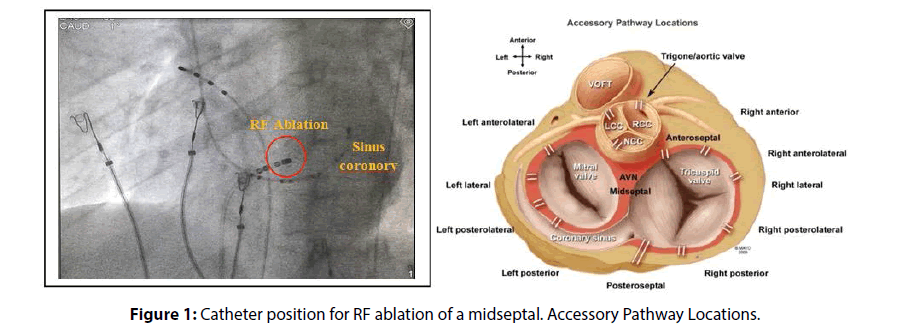
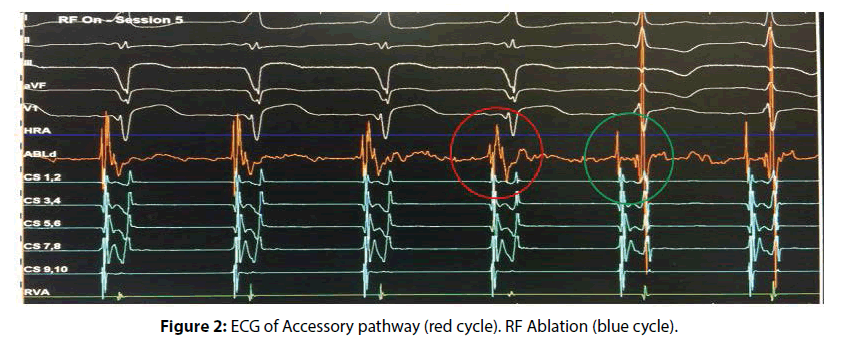
In this study, our new algorithm was tested propectively in 109 patients were compared with the location of APs confirmed by successful RCRA from June 2016 to May 2017 year (Figures 1 and 2). We were Calculated values of sensitivity (Se), specificity (Sp), positive predictive value (PPV) and negative predictive value (NPV) of the predict accessory pathway location.
WPW syndrome was defined as the 12-lead ECG is characterized by a shortened PR interval <120 milliseconds, widened QRS duration ≥110 milliseconds, and delta wave [1]. Localization of AP confirmed by successfully RCFA (gold standard) [2,8].
Statistical analysis
Collected data were analyzed by the medical statistical method using IBM SPSS 21.0 software.
Results
In 109 patients, 56 men (51.4%) and 53 female (48.6%), p>0.05, 43.6±14.9 years. Among 109 APs was most common location as Left sided APs was found in 58 (53.2%), and right sided APs had 51 patients (46.8%). Right side free wall was 23 (21.1%) with 9 patients had RAL (8.3%), 5 patients had RL (4.6%) and 9 patients had RPL (8.3%). Left side free wall was 45 (41.3%) with 12 patients had LAL, 25 patients had LL (24.0%) and 8 patients had LPS (7.3%). Septal accessory pathways was found in 41 (37.6%) with 23 patients had RPS (21.1%), 13 patients had LPS (11.9%), 4 patients had RMS (3.7%), 1 patients had RAS (0.9%) (Figure 1).
Left side includes left septal (LPS) and left free wall accessory pathways (LAL, LL, LPL) in around the mitral valve. Right side includes right septal (RAS, RMS, RPS) and right free wall accessory pathways (RAL, RL, RPL) in around the tricuspid valve (Figure 1).
Accuracy of the algorithm for localizing APs in the left side or right side pathways by positive or negative delta waves in lead V1 was found in very highly accurate, giving a sensitivity of 98.3%, specificity of 92.2%, PPV of 93.4% and NPV of 97.9% (R=-0.909, p<0.0001) (Tables 1 and 9).
| Location Delta wave polarity in lead V1 |
Left side AP | Right side AP | Total |
|---|---|---|---|
| Positive delta wave in lead V1 | 57 | 4 | 61 |
| Negative delta wave in lead V1 | 1 | 47 | 48 |
| Total (n) | 58 | 51 | 109 |
Table 1: Positive or negative delta waves in lead V1 for the left or right side AP.
Septal location includes the right septal (RAS, RMS, RPS region) and left septal (LPL region) (Figure 2). Free wall location includes the right free wall lateral (RAL, RL, RPL region) and Left free wall lateral (LAL, LL, LPL region) (Figure 1).
Accuracy of the difference in septal or free wall location by the QRS complex transition at lead V1V2 or after V1V2/before V1 was found in very highly accurate, giving a sensitivity of 87.8%, specificity of 97.1%, PPV of 94.7% and NPV of 93% (R=0.835, p<0.0001) (Tables 2 and 9).
| Location of AP Position of QRS transition |
Septal location | Free wall location | Total |
|---|---|---|---|
| Leads V1,V2 | 36 | 2 | 38 |
| After leads V1,V2 (V3-V6), or before V1 | 5 | 66 | 71 |
| Total (n) | 41 | 68 | 109 |
Table 2: The QRS complex transition on 12 lead-ECG for the septal or free wall location.
Anterior location includes anterolateral (LAL, RAL region) and anteroseptal (RAS region) of mitral or tricuspid valves (Figure 3). Posterior location includes posterolateral (LPL, RPL region) and posteroseptal (LPS, RPS region) of mitral or tricuspid valves (Figure 1).
Accuracy of the difference in the anterior or posterior location by positive or negative delta waves in at least 2/3 inferior lead was found in very highly accurate, giving a sensitivity of 100%, specificity of 88.7%, PPV of 78.6% and NPV of 100% (R=0.863, p<0.0001) (Tables 3 and 9). Difference between the RAL or RL/RPL regions by positive or negative delta waves in at least 2/3 inferior lead was found in 9 of 9 patients (100%) and 13 of 14 patients (92.9%) (Figure 3), giving a Se of 100%, Sp of 92.9%, PPV of 90% and NPV of 100% (R=0.914, p<0.0001) (Tables 4 and 9). Difference between the RAL/RL and RPL region by positive or negative QRS complex in at least 2/3 inferior lead with high accuracy (Figure 3), giving a Se of 92.9%, Sp of 77.8%, PPV of 86.7% and NPV of 87.5% (R=0.724, p<0.0001) (Tables 5 and 9).
| Location Delta wave polarity in inferior lead |
Anterior location | Posterior location | Total |
|---|---|---|---|
| Positive delta waves in at least 2/3 inferior | 22 | 6 | 28 |
| Negative Delta waves in at least 2/3 inferior | 0 | 47 | 47 |
| Total (n) | 22 | 53 | 75 |
Table 3: Delta wave polarity in at least 2/3 inferior lead for the anterior or posterior location.
| Location Delta waves polarity in inferiorlead | Right anterolateral (RAL) | Right lateral (RL) | Right posterolateral (RPL) | Total |
|---|---|---|---|---|
| Positive delta waves in at least 2/3 inferior | 9 | 1 | 0 | 10 |
| Negative delta waves in at least 2/3inferior | 0 | 4 | 9 | 13 |
| Total (n) | 9 | 5 | 9 | 23 |
Table 4: Positive or negative delta waves in at least 2/3 inferior lead (DII, DIII, aVF).
| Location QRS complex polarity |
Right anterolateral (RAL) | Right Lateral (RL) | Right Posterolateral (RPL) | Total |
|---|---|---|---|---|
| Positive QRS complex in at least 2/3 inferior | 9 | 4 | 2 | 15 |
| Negative QRS complex in at least 2/3 inferior | 0 | 1 | 7 | 8 |
| Total (n) | 9 | 5 | 9 | 23 |
Table 5: Positive or negative QRS complex in at least 2/3 inferior lead (DII, DIII, aVF).
Furthermore, difference between the RL and RPL region by positive or negative QRS complex in at least 2/3 inferior lead with high accuracy, giving a Se of 80%, Sp of 77.8%, PPV of 66.7% and NPV of 87.5% (R=0.559, p<0.05).
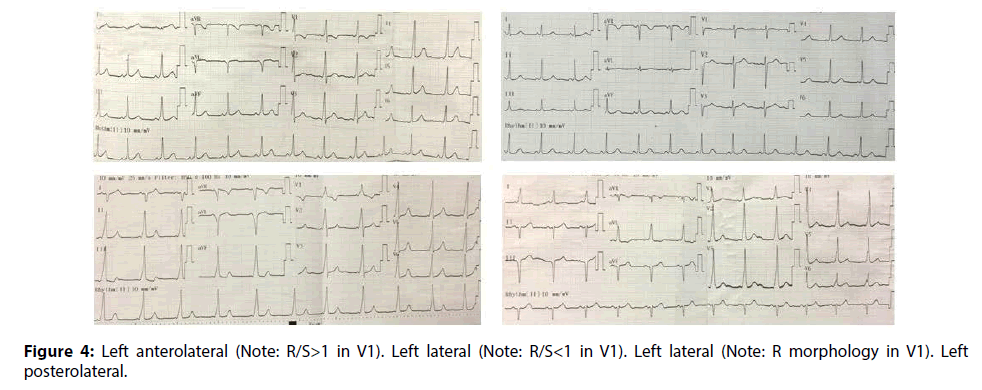
Accuracy of the LAL and LL region had positive delta waves in at least 2/3 inferior lead was found 12/12 (100%) and 25/25 (100%), respectively. Therefore, Accuracy of the difference between includes LAL/LL and LPL region by positive or negative delta waves in at least 2/3 inferior lead was found very highly accurate (Figure 4), giving a Se of 100%, Sp of 75%, PPV of 94.9% and NPV of 100% (R=0.844, p<0.0001). Accuracy of the different in the LAL or LL region by R/S ratio >1 (91.7%) or R/S ratio <1 (40%), R morphology (36%) in lead V1 was found highly accurate (Figure 4), giving a Se of 91.7%, Sp of 76%, PPV of 64.7% and NPV of 95% (R=0.636, p<0.0001) (Tables 6 and 9).
| Location Delta waves polarity in inferiorlead |
Left antero lateral (LAL) | Left lateral (LL) |
Left postero lateral (LPL) | Total |
|---|---|---|---|---|
| Positive delta waves in at least 2/3 inferior | 12 | 25 | 2 | 39 |
| Negative delta waves in at least 2/3inferior | 0 | 0 | 6 | 6 |
| Total (n) | 12 | 25 | 8 | 45 |
Table 6: Positive or negative delta waves in at least 2/3 inferior lead (DII, DIII, AVF).
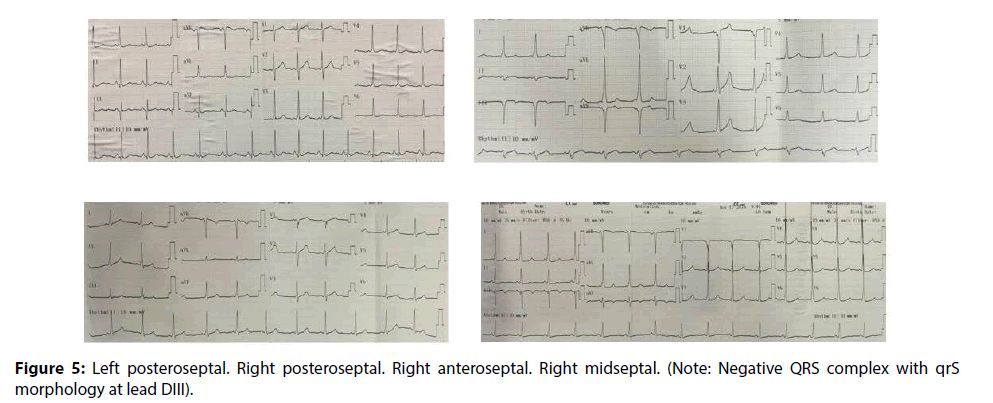
Accuracy of the different in the left septal or right septal side by positive or negative delta wave in lead V1 was very significantly higher, giving Se of 100%, Sp of 89.3%, PPV of 81.3% and NPV of 100% (R=- 0.852, p<0.0001). Accuracy of the different in the anteroseptal or posteriorseptal sites by positive or negative delta waves in at least 2/3 inferior lead was very significantly higher (Figure 5), giving Se of 100%, Sp of 88.9%, PPV of 20% and NPV of 100% (R=0.422, p<0.001) (Tables 7 and 9).
| Location R/S ratio in V1 |
Left antero lateral (LAL) | Left lateral (LL) | Total | ||
|---|---|---|---|---|---|
| n | Rate (%) | n | Rate (%) | ||
| R/S > 1 | 11 | 91,7% | 6 | 24% | 17 |
| R/S < 1 | 0 | 0% | 10 | 40% | 10 |
| QRS morphology: R | 1 | 8,3% | 9 | 36% | 10 |
| Total (n) | 12 | 25 | 37 | ||
Table 7: R/S ratio in lead V1 for the left anterolateral and left lateral region.
Accuracy of the different in midseptal or no midseptal (anteroseptal and posteriorseptal sites) by Qrs pattern (Qrs, qRs, qrS) or no Qrs pattern at least 1/3 inferior lead was very significantly higher (Figure 5), giving a Se of 75%, Sp of 91.9%, PPV of 50% and NPV of 97.1% (R=0.562, p<0.0001) (Tables 8 and 9).
| Location QRS complex morphology |
Midseptal | No midseptal (Anteroseptal and posteroseptal) | Total |
|---|---|---|---|
| Qrs pattern (Qrs, qRs, qrS) | 3 | 3 | 6 |
| No Qrs pattern (Qrs,qRs,qrS) | 1 | 34 | 35 |
| Total (n) | 4 | 37 | 41 |
Table 8: QRS complex morphology in at least 1/3 inferior lead with septal or no midseptal.
| Accessory Pathway Site (n=109) | Se (%) | Sp (%) | PPV (%) | NPV (%) |
|---|---|---|---|---|
| Right side or left side location | 98.3% | 92.2% | 93.4% | 97.9% |
| Anterior or posterior location | 100% | 88.7% | 78.6% | 100% |
| Septal or Free wall lateral location | 87.8% | 97.1% | 94.7% | 93% |
| RAL with RL/RPL region by positive or negative delta wave in at least 2/3 inferior lead | 100% | 92.9% | 90% | 100% |
| RAL/RL with RPL region by positive or negative QRS complex in at least 2/3 inferior lead | 92.9% | 77.8% | 86.7% | 87.5% |
| RL with RPL region by positive or negative QRS complex in at least 2/3 inferior lead | 80% | 77.8% | 66.7% | 87.5% |
| LAL/LL with LPL region by positive or negative QRS complex in at least 2/3 inferior lead | 100% | 75% | 94.9% | 100% |
| LAL with LL region by R/S ration in V1 lead | 91.7% | 76% | 64.7% | 95% |
| Left or Right septal accessory pathways | 98.3% | 89.3% | 81.3% | 97.9% |
| Anteroseptal with posteroseptal (RPL/LPL) region | 100% | 88.9% | 20% | 100% |
| Midseptal or no midseptal (RAS/RPL/LPL) region | 75% | 91.9% | 50% | 97.1% |
| Midseptal or other right septal (RAS/RPL) region | 75% | 92.3% | 75% | 92.3% |
Table 9: Sensitivity, Specificity, PPV and NPV Value of the Proposed Algorithm for accessory pathway Site in 109 patients.
All patients (n=109) with accessory pathways required less mean procedure time was 48.7±18.5 minutes and less mean fluoroscopy time was 7.2±4.0 minutes. Left side accessory pathways required less mean procedure time was shorter than right side accessory pathway (44.9±14.5 and 52.9±21.5 minutes) with p<0.05; but the less mean fluoroscopy time of left side and right side were the same time (7.3±4.2 and 7.0±3.8 minutes) with p>0.05. Beside, left side location required lest mean ablation time and mean ablation was shorter than right side location (261.6±110.6 & 368.1±202.5, 5.7±3.7 & 10.9±8.3) with p<0.01 and p<0.001 (Table 9).
Discussion
The results showed that difference in the left side or right side pathways by positive or negative delta wave in lead V1 with very high accuracy. Chang showed that Se of 94.4% and Sp of 87.5% [6]; Rostock proposed to left side of right side pathways by R/S ratio on V1, aVR, aVL with Se of 95%, Sp of 100%, and PPV of 98% [9].
Difference between the Septal and free wall accessory pathways by QRS complex transition at lead V1V2 or after V1V2/before V1 are very high accuracy as our prediction [10].
Different in the Anterior or posterior location by positive or negative delta waves in at least 2/3 inferior lead with high accuracy as our prediction before intervention [10].
Accuracy of difference between the RAL and RL/ RPL region by positive or negative delta waves in at least 2/3 inferior lead was very significantly higher.
The problem is that we were a need to predict the different between right lateral or right posterolateral pathways. Accuracy of the different in the RL or RPL region by positive or negative QRS complex was found rather highly accuracy (Figure 3). Furthermore, difference between RAL/RL and RPL region by positive or negatie QRS complex was significantly higher; Therefore, the doctors had two methods in predicting between RL and RPL region before RCFA.
Almost studies have not clearly defined between three regions of the right free wall, especially between the right lateral and posterolateral [4,5,7,9,10]. Muhammad studied many parameters and showed that the value of localizing in right side with Se of 92% and Sp of 100%; but right free wall pathways were only two locations (right antero and right posterolateral pathways) [10].
Accuracy of the different in the LAL/LL or LPS region by positive or negative delta waves in at least 2/3 inferior lead was very significantly higher. Almost studies do not distinguish between these two regions (LAL and LL region) [4,5,7,9,10]. The problem is that we were a need to predict the difference between the LAL and LL region. Accuracy of prediction between the LAL and LL region by R/S ratio >1 or R/S<1, R in V1 was found highly accurate (Figure 4); However, the predictive value was not high (64.7%); Therefore, the doctors must be attention to consideration for these cases in during procedure of RCFA.
Accuracy of prediction for the septal location for the left or right septal by positive or negative delta wave in lead V1, the septal or free wall location by QRS complex transition at leads V1V2 or after V1V2/before V1, anteroseptal or posteroseptal by positive or negative QRS complex in at least 2/3 inferior lead as the our predicting before RCFA [4,6,10]. The problem is that we were a need to predict the difference between the midseptal with anteroseptal and posteroseptal. This “Qrs pattern” in at least 1/3 inferior lead (DII, DIII, aVF) was significantly higher with Se of 75% and Sp of 91.9% for a midsepta1 region (Figure 5). D’avila was only studied on DIII lead [5].
Overall, the 12-lead ECG parameters closely related to AP location, this new algorithm to predict the location of accessory pathways was high accuracy with very significantly higher (Figure 6).
The role of the 12 lead ECG with parameter as above to predict a successful ablation site can help to the procedure time and fluoroscopy time were significantly shorten. Fluoroscopy is safe because according to Igor the mean fluoroscopy time for per case had over 48 minutes and over 4 case for per weeks was cause on chromosomal aberration [11-15].
Conclusion
We used our new algorithm was proved to be high accuracy (Se and Sp from 75% to 100%) for the other locations of accessory pathways. The results showed that the difference in the left or right side with sensitivity of 98.3% and specificity of 92.2%. Difference between anterior (RAL, LAL, RAS) or posterior (RPL, LPL, RPS, LPS) location is Se of 100% and Sp of 88.7%. Difference in the septal or free wall lateral sites is Se 87.8% and Sp 97.1%. Difference between midseptal and other septals is Se 75% and Sp 97.3%; different in the RL and RPL region with Se 80% and Sp 77.8%; Different in the LAL and LL region with Se 91.7% and Sp 76%; and could facilitate radiofrequency ablation in patiens with left side or right side pathways.
To predict a successful ablation site can help to the procedure time and fluoroscopy time were significantly shorten, its fluoroscopy safety.
References
- Borys S. Chou’s Electrocardiography in clinical practice: Adult and Pediatric. Sixth Edition. Springer. pp: 23 (2008).
- Tarek B. Prospective validation of a sezer ECG algorithm for localization of accrssory pathways in patients with Wolff-Parkinson-White syndrome. AAMJ. 10: 2 (2012).
- Lemery R. Success, safety, and late electrophysiological outcome of low-enery direct-current ablation in patients with the Wolff-Parkinson-White syndrome. Circulation. J. Am. Heart. Assoc. 85: 957-962 (1992).
- Giorgi C, Primeau R. Comparative accuracy of the vectorcardiogram and electrocardiogram in the localization of the accessory pathway in patients with Wolff-Parkinson-White syndrome: Validation of a new vectorcariographic algorithm by intraoperative epicardial mapping and electrophysiologic studies. Am. Heart. J. 119: 592-598 (1990).
- D' avila A, Brugade J, Skeberis V, et al. A fast and reliable algorithm to localize accessory pathways based on the polarity of the QRS Complex on the surface ECG. During Sinus Rhythm. PACE. 18: 1615-1627 (1995).
- Chern-En C, Wee ST. An accurate stepwise electroardiographic algorithm for localization of accessory pathways in patients with Wolff-Parkinson-White syndrome from a Comprehensive Analysis of Delta Waves and R/S Ratio during Sinus Rhythm. Am. J. Cardiol. 76: 40-46 (1995).
- Noriko T, Yasuya I. A simple algorithm for localizing accessory pathways in patients with Wolff-Parkinson-White syndrome using only the R/S ratio. J. Arrhyth. 30 (6): 439-443 (2014).
- Macedo PG, Bisco SE, and Asirvatham SJ. Septal Accessory Pathway: Anatomy, Causes for Difficulty, and an Approach to Ablation. Ind. Pacing. Electrophysiol. J. 10: 292-309 (2013).
- Thomas R, Daniel S. A new algorithm for concealed accessory pathway localization using T-wave-subtracted retrograde P-wave polarity during orthodromic atrioventricular reentrant tachycardia. J. Interv. Card. Electrophysiol. 22: 55-63 (2008).
- Muhammad AD, Abdul RA. Localization of accessory pathways according to AP Fitzpatrick ECG criteria in patients with Wolff-Parkinson-White syndrome in our population. Pak. Heart. J. 41: 25 (2008).
- Calkins H, Langberg J, Sousa J, et al. Radiofrequency Catheter Ablation of Accessory Atrioventricular Connections in 250 Patients Abbreviated Therapeutic Approach to Wolff-Parkinson-White Syndrome. Circulation. 85: 1337-1346 (1992).
- Dong VT. Doctor of Philosophy Thesis in medicine: Research in Electrophysiology and Treatment of Wolff-Parkinson-White Syndrome by Radiofrequency Catheter Ablation. Viet. Mil. Med. Uni. 52: 23 (2006).
- Haghjoo M, Mahmood E, Fazelifar AF, et al. Electrocardiographic and Electrophysiologic Predictors of Successful Ablation Site in Patients with Manifest Posteroseptal Accessory Pathway. PACE. 31: 103-111 (2008).
- Schwagten B, Ayerza MR. A randomized comparison of Transseptal and Transaortic Approaches for Magnetically Guided Ablation of Left-Sided Accessory Pathways. PACE. 33: 1298-1303 (2010).
- Igor S. Clinical manual of electrophysiology 1993. Williams & Wilkins, Baltimore. pp: 52-68 (1993).
